CoveragePost
January 30, 2021
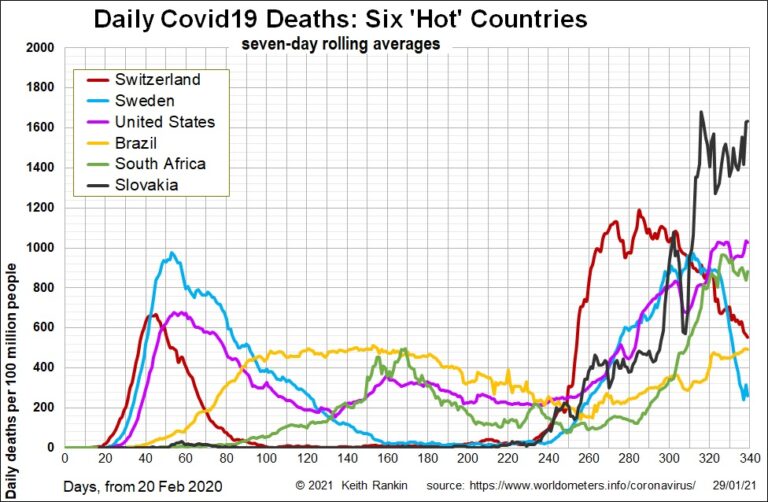
Analysis by Keith Rankin. Here I include three European countries and three others well known for their Covid19 issues. Of the European countries, Switzerland was first to be hit, and did substantially suppress the epidemic. Sweden was hit for a prolonged period, but eventually got the problem down to ‘acceptable’ levels. Slovakia – the only one ... <a title="Keith Rankin Chart Analysis – Covid-19: Deaths in Six Covid-Hot Countries" class="read-more" href="https://eveningreport.nz/2021/01/30/keith-rankin-chart-analysis-covid-19-deaths-in-six-covid-hot-countries/" aria-label="Read more about Keith Rankin Chart Analysis – Covid-19: Deaths in Six Covid-Hot Countries">Read more</a>
CoveragePost
January 22, 2021
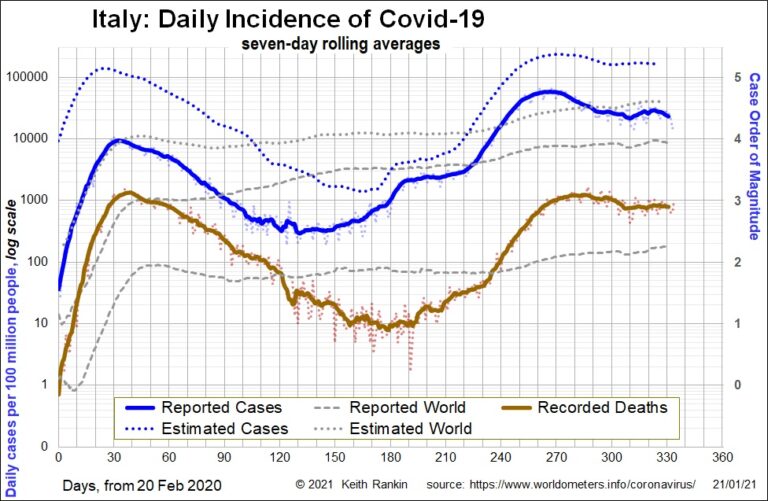
Analysis by Keith Rankin. With Covid19, Italy shows the classic European pattern, with its early outbreak, substantial recovery thanks to lockdowns and other public health measures, and resurgence thanks to complacency and summer mingling. Brazil, on the other hand, shows a pattern, even more extreme than the USA, of an outbreak that did not go away. ... <a title="Keith Rankin Chart Analysis – Covid-19: Italy and Brazil – Three Perspectives" class="read-more" href="https://eveningreport.nz/2021/01/22/keith-rankin-chart-analysis-covid-19-italy-and-brazil-three-perspectives/" aria-label="Read more about Keith Rankin Chart Analysis – Covid-19: Italy and Brazil – Three Perspectives">Read more</a>
CoveragePost
January 15, 2021
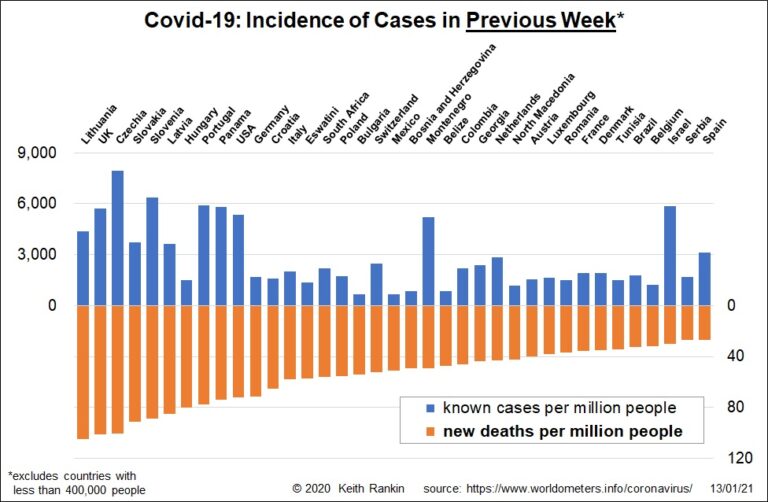
Analysis by Keith Rankin. The countries with the most recent large outbreaks of Covid19 are those with large numbers of recent recorded cases, but yet to record the deaths that most likely will result. In this camp, this time, are Ireland, Israel (its third major outbreak), and Lebanon. Of these, only Israel features in my ... <a title="Keith Rankin Chart Analysis – Covid-19: Worst Countries in the New Year" class="read-more" href="https://eveningreport.nz/2021/01/15/keith-rankin-chart-analysis-covid-19-worst-countries-in-the-new-year/" aria-label="Read more about Keith Rankin Chart Analysis – Covid-19: Worst Countries in the New Year">Read more</a>
CoveragePost
January 9, 2021
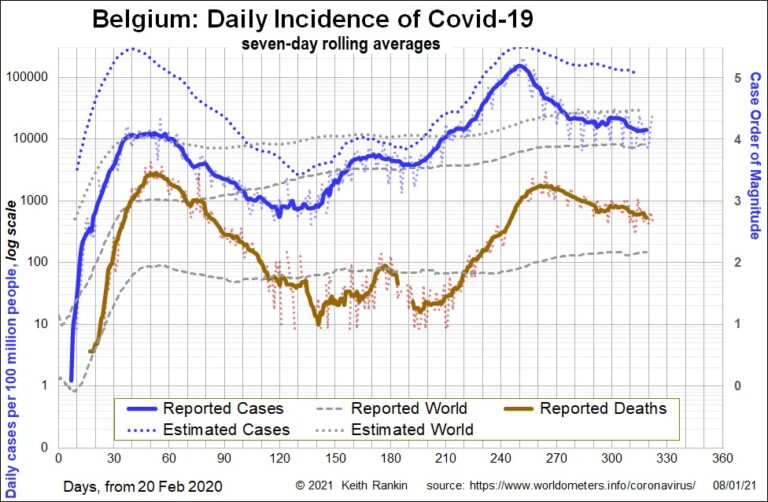
Analysis by Keith Rankin. In my latest charts, I include a robust set of estimates of actual proportion of people who have – or have had – Covid19. The principal basis for these estimates is the number of deaths being recorded. Using the appropriate log scale for such charts, we can see that Belgium’s ‘second ... <a title="Keith Rankin Chart Analysis – Covid-19: Belgium and Ireland – Three Perspectives" class="read-more" href="https://eveningreport.nz/2021/01/09/keith-rankin-chart-analysis-covid-19-belgium-and-ireland-three-perspectives/" aria-label="Read more about Keith Rankin Chart Analysis – Covid-19: Belgium and Ireland – Three Perspectives">Read more</a>
CoveragePost
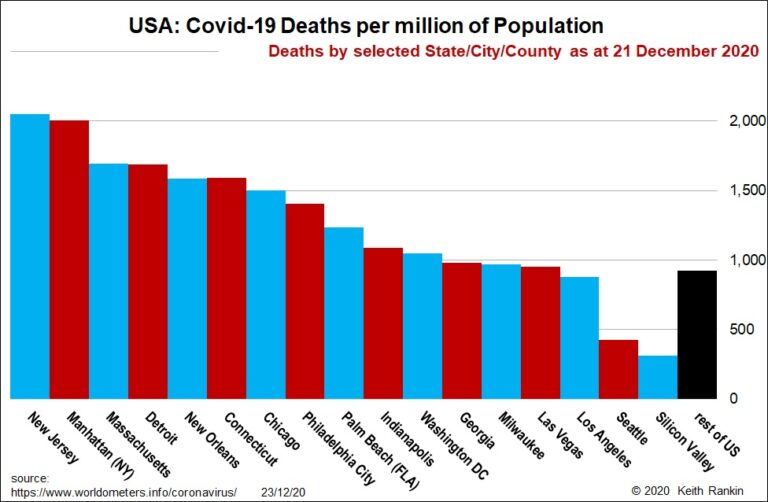
December 23, 2020
Analysis by Keith Rankin. The parts of the USA with the highest Covid19 death rates – New Jersey and New York City – have lost two in every thousand persons in their populations. That’s consistent with 40 percent of the populations of these places having been infected with the disease, based on a 0.5% case ... <a title="Keith Rankin Chart Analysis – Covid-19: United States in December compared to March" class="read-more" href="https://eveningreport.nz/2020/12/23/keith-rankin-chart-analysis-covid-19-united-states-in-december-compared-to-march/" aria-label="Read more about Keith Rankin Chart Analysis – Covid-19: United States in December compared to March">Read more</a>
CoveragePost
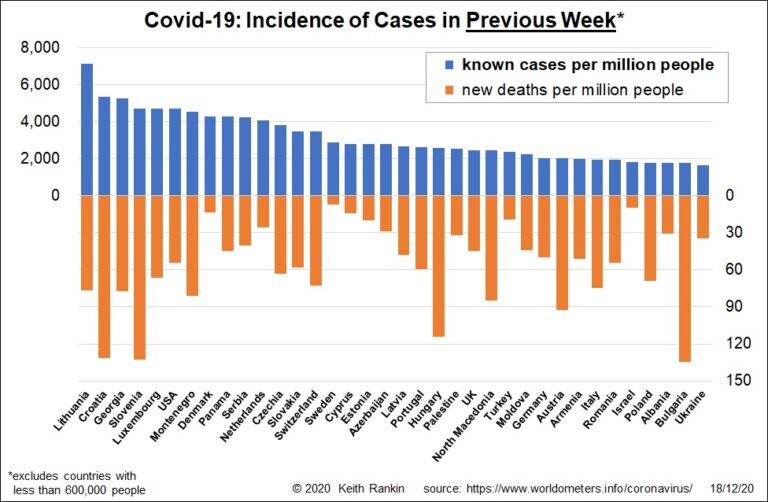
December 21, 2020
Analysis by Keith Rankin. We in New Zealand hear so little about the tragedy unfolding in Eastern Europe, including the Baltic and Caucasian States. These countries have very cold winters, increased inequality, poverty, and popular nationalism (aka ‘populism’). But they are low on the queue for media coverage (and we don’t tend to regard anti ... <a title="Keith Rankin Chart Analysis – Covid-19: Worst Countries, pre-Christmas" class="read-more" href="https://eveningreport.nz/2020/12/21/keith-rankin-chart-analysis-covid-19-worst-countries-pre-christmas/" aria-label="Read more about Keith Rankin Chart Analysis – Covid-19: Worst Countries, pre-Christmas">Read more</a>
CoveragePost
December 16, 2020
Analysis by Keith Rankin. With respect to the Covid19 pandemic, our news media is biased towards the United States and Western Europe. Little do we know that the worst affected region of the world over the last month or two has been Eastern Europe and the Caucasus. This region was relatively unaffected in March and ... <a title="Keith Rankin Chart Analysis – Covid-19: Eastern Europe and Canada" class="read-more" href="https://eveningreport.nz/2020/12/16/keith-rankin-chart-analysis-covid-19-eastern-europe-and-canada/" aria-label="Read more about Keith Rankin Chart Analysis – Covid-19: Eastern Europe and Canada">Read more</a>
CoveragePost
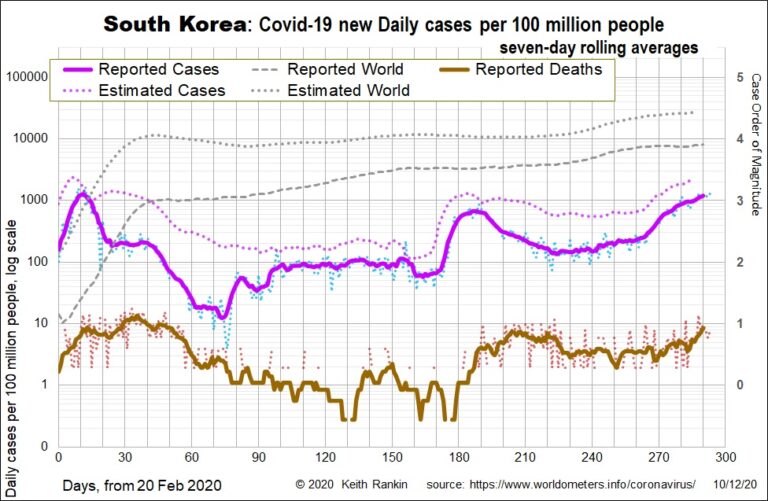
December 11, 2020
Analysis by Keith Rankin – estimates, magnitudes, and new countries to be concerned about. In mid-November, I published Covid-19: Orders of Magnitude. I used Turkey as my example of a Covid19 magnitude 3 country, and South Korea as my magnitude 2 example. Today, less than a month later, Turkey is now looking like a magnitude ... <a title="Keith Rankin Chart Analysis – Covid-19: Worsening Incidence in Asia, USA, and Denmark" class="read-more" href="https://eveningreport.nz/2020/12/11/keith-rankin-chart-analysis-covid-19-worsening-incidence-in-asia-usa-and-denmark/" aria-label="Read more about Keith Rankin Chart Analysis – Covid-19: Worsening Incidence in Asia, USA, and Denmark">Read more</a>
CoveragePost
December 4, 2020
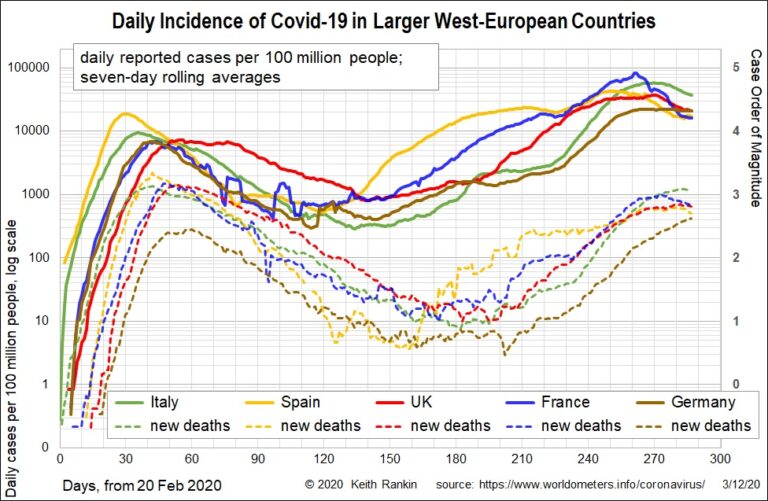
Analysis by Keith Rankin. This week, Covid19 cases in most large European countries are passing their peak following four months of exponential growth, thanks to belated new ‘lockdown’ restrictions. The exception – or laggard – is Germany, which has generally been praised as the European exemplar of how Covid19 should be managed. Germany has converged with ... <a title="Keith Rankin Chart Analysis – Covid-19: Transmission and Convergence" class="read-more" href="https://eveningreport.nz/2020/12/04/keith-rankin-chart-analysis-covid-19-transmission-and-convergence/" aria-label="Read more about Keith Rankin Chart Analysis – Covid-19: Transmission and Convergence">Read more</a>
CoveragePost
November 27, 2020
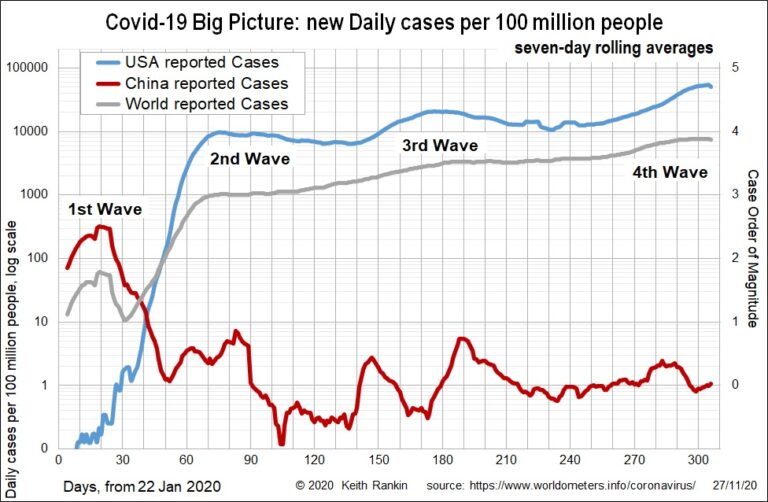
Analysis by Keith Rankin. This week’s charts extend the period covered to January 2020, when almost all recorded cases were in China. Cases came into other countries in late January, including the United States in dribs and drabs, and were largely contained. All this changed with the European outbreak in mid-February. Thus, the First Wave ... <a title="Keith Rankin Chart Analysis: Covid-19: Orders of Magnitude – USA vs. China, World" class="read-more" href="https://eveningreport.nz/2020/11/27/keith-rankin-chart-analysis-covid-19-orders-of-magnitude-usa-vs-china-world/" aria-label="Read more about Keith Rankin Chart Analysis: Covid-19: Orders of Magnitude – USA vs. China, World">Read more</a>
CoveragePost
November 18, 2020
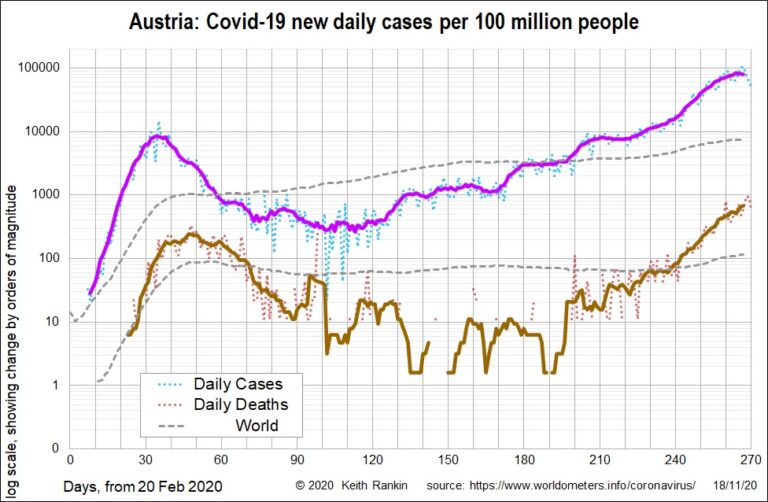
Analysis by Keith Rankin. Today I have chosen six countries, each with Covid19 case experiences over the last three weeks (days 250 to 270) that are orders of magnitude apart. A country with 1,000 daily cases per 100 million people is classed as magnitude three; that’s three zeros after the ‘one’. A country with 1 ... <a title="Keith Rankin Chart Analysis – Covid-19: Orders of Magnitude" class="read-more" href="https://eveningreport.nz/2020/11/18/keith-rankin-chart-analysis-covid-19-orders-of-magnitude/" aria-label="Read more about Keith Rankin Chart Analysis – Covid-19: Orders of Magnitude">Read more</a>
CoveragePost
November 16, 2020
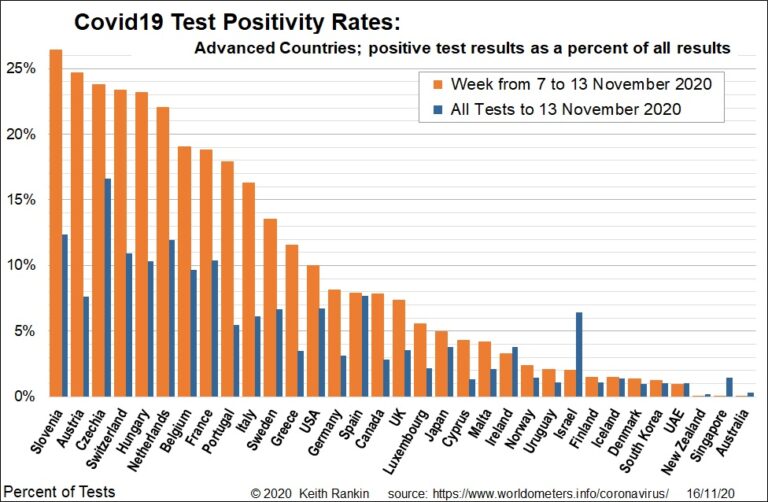
Analysis by Keith Rankin. The above chart shows the world’s most economically developed countries, including three of the most developed in Eastern Europe (Slovenia, Hungary and Czechia), and one of the most developed in South America (Uruguay). In early November, the countries with the most positive results are all clustered around Austria, in central Europe. ... <a title="Keith Rankin Chart Analysis – Test Positivity Rates are a Measure of a Country’s Covid-19 Outbreak" class="read-more" href="https://eveningreport.nz/2020/11/16/keith-rankin-chart-analysis-test-positivity-rates-are-a-measure-of-a-countrys-covid-19-outbreak/" aria-label="Read more about Keith Rankin Chart Analysis – Test Positivity Rates are a Measure of a Country’s Covid-19 Outbreak">Read more</a>