Analysis by Keith Rankin.
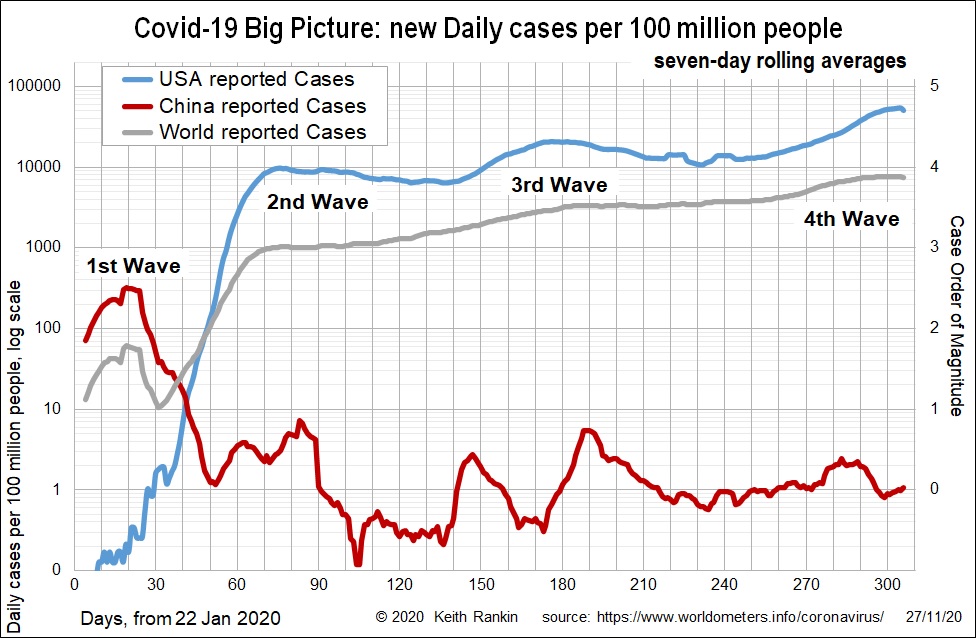
This week’s charts extend the period covered to January 2020, when almost all recorded cases were in China. Cases came into other countries in late January, including the United States in dribs and drabs, and were largely contained. All this changed with the European outbreak in mid-February.
Thus, the First Wave of Covid19 was the China wave, and the Second Wave was the massive European outbreak which quickly extended into the United States, especially New York City. By the very end of February, the rest of the world overtook China, with the vast majority of cases then being in Europe, but also many cases in South Korea. At the very beginning of March, the United States overtook China.
At the beginning of April – day 70 – the second wave peaked in the United States, but Covid19 effectively plateaued, the decline in new cases was very slow. For the world as a whole, Covid19 continued to grow – albeit at a slower pace – as it spread through more countries and continents.
By day 90 – the third week of April – Covid19 incidence had dropped to ‘magnitude zero’ in China, where magnitude zero represents one case per 100 million people (ten cases per billion). The world was then at ‘magnitude three’ (1,000 times worse than China) and the United States at ‘magnitude four’ (10 times worse than the world as a whole). China has averaged magnitude one since then, with a couple of outbreaks which were quickly snubbed out. The steady diet of about 14 cases per day in China can presumably be attributed to cases caught at the border.
The Third Wave of Covid19 began as a new wave of global exponential growth around day 110 – the beginning of June. It showed up strongly in the United States in July, and can be understood as the South American wave. World cases then flattened in August, although that was the panic month in Australia and New Zealand.
The Fourth Wave began late in September – around day 250. It was most likely linked to holidaymakers returning to Europe and United States at the end of the northern summer. This fourth wave accelerated in October (especially in Europe), as winter beckoned, and then accelerated further in early November in the United States. This second European wave was offset, in October in the global data, by case reductions in South America, moving out of winter.
Globally, there has been exponential growth from April, interspersed with two periods of near-zero growth; but no periods of decline. World incidence of Covid19 is now close to ‘magnitude four’ (10,000 times worse than China’s baseline). While the United States appears to have reached its fourth wave peak, it may in fact resurge to Covid19 ‘magnitude five’ as a result of Thanksgiving this week and, in a month, Christmas and New Year; indeed the reduction in reported cases today is probably because of yesterday’s national holiday in the USA.
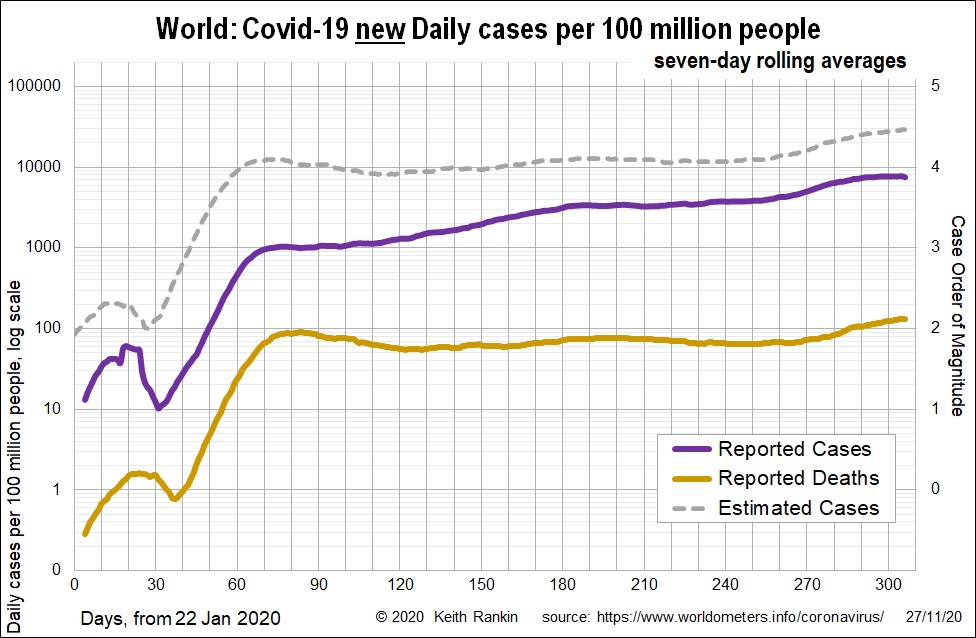
The second chart expands on the world data, showing cases in purple and death in brown. The death statistics represent a sad but steady stream for the eight months from the beginning of April. Daily deaths are now at their highest to date (ie at around day 305), nearly 50 percent higher than the second wave peak (day 84).
I have made conservative estimates of the true global incidence of Covid19, from the recorded death rate, and allowing for a 10-day lag (ie deaths tend to peak 10 days after cases). For cases in November, I have assumed a death rate of five in a thousand. At the beginning of the pandemic, I assumed a death rate of ten in a thousand.
My daily case estimate for this week is 30,000 in 100 million; which means three people in 10,000 are being infected by Covid19 every day; equivalent to five people in Feilding getting Covid19 every day on average.
These case estimates will still be underestimates, because the known death figures themselves are underestimates, with recording practices varying significantly on a country by country basis. If we allow for this, then there are now three million people in the world catching Covid19 every day, five times more than the reported global daily count of 600,000.