Analysis by Keith Rankin.
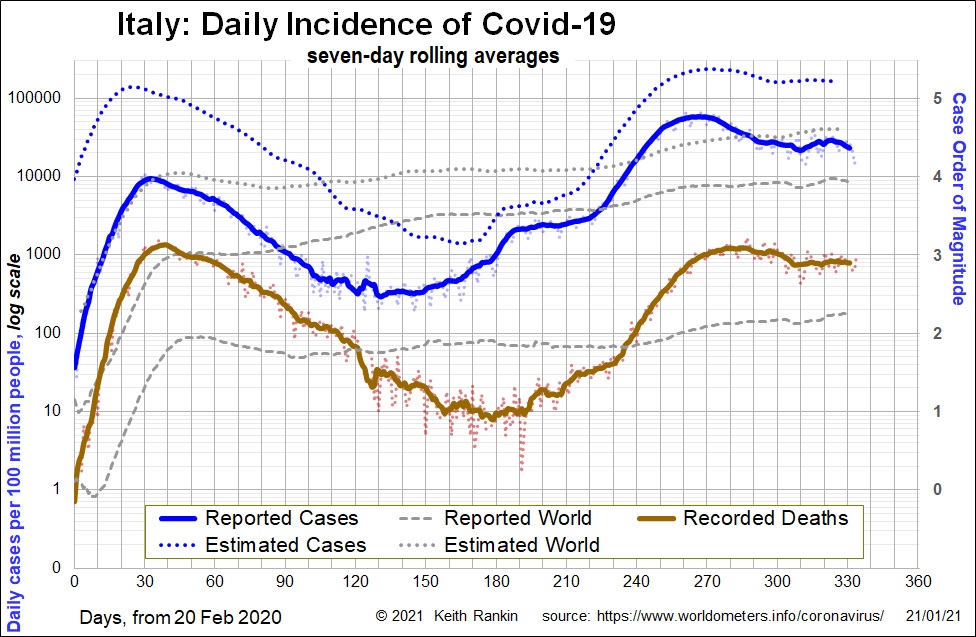
With Covid19, Italy shows the classic European pattern, with its early outbreak, substantial recovery thanks to lockdowns and other public health measures, and resurgence thanks to complacency and summer mingling.
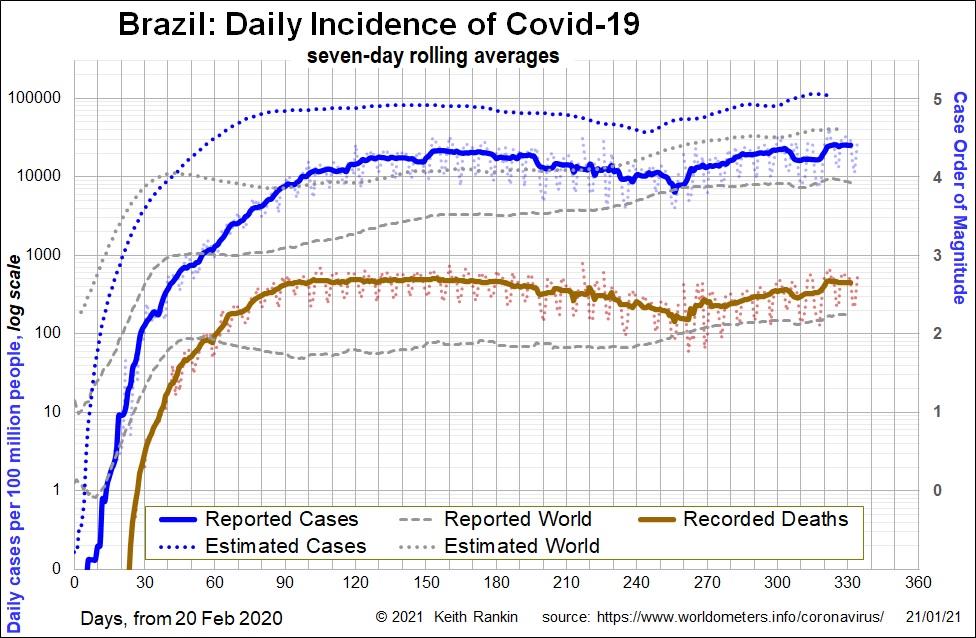
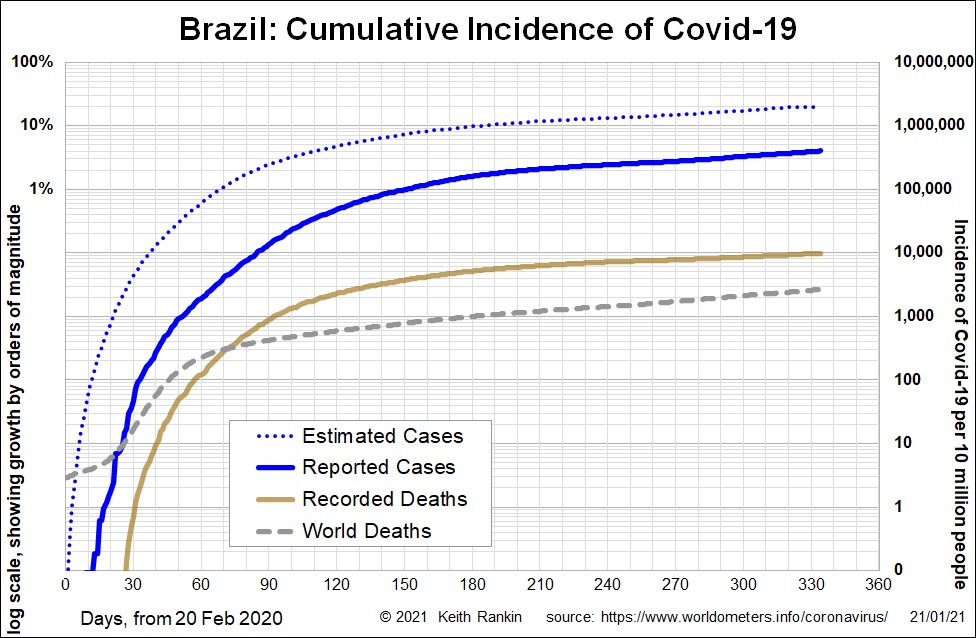
Brazil, on the other hand, shows a pattern, even more extreme than the USA, of an outbreak that did not go away. Brazil has been above case magnitude 4 for almost the entire time from the beginning of June to the present.
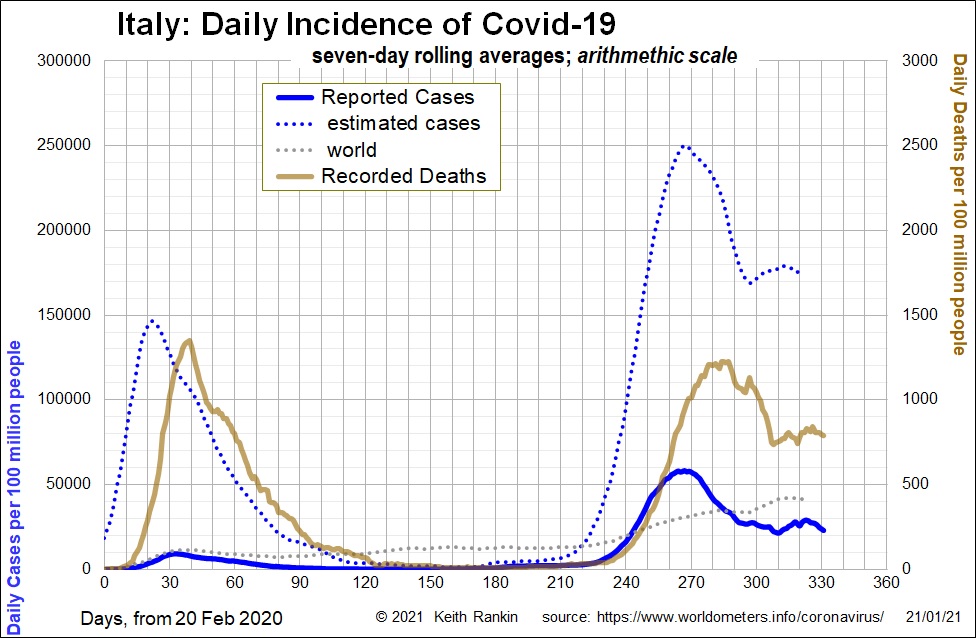

The arithmetic scale does convey the true scale of these countries’ outbreaks. But only after the event. For Italy, while the exponential decline after the first wave was slower than the initial exponential increase, the chart gives the impression that Covid19 was all but eliminated in Italy during the northern summer. (The earlier chart for Italy shows that exponential growth of cases in Italy recommenced in July.) This ‘rear-view’ chart shows that the second wave in Italy had more cases, and that the period of high deaths lasted longer, and indeed refused to go away over the Christmas New Year period.
In Brazil the case rates and death rates never came close to Italy’s peaks. What we do see is a late second wave that is still in full swing, and is almost certainly due to an unwary Brazil importing the North Atlantic “second wave”, much as it had imported the “first wave”. Brazil never had the winter conditions associated with the rapid outbreaks in the northern countries. Rather, it just kept the door open to the SARS-Cov2 virus.
We might note that, for New Zealand, and using the same scale, all of the data series would show as straight lines along the bottom axis of the chart.
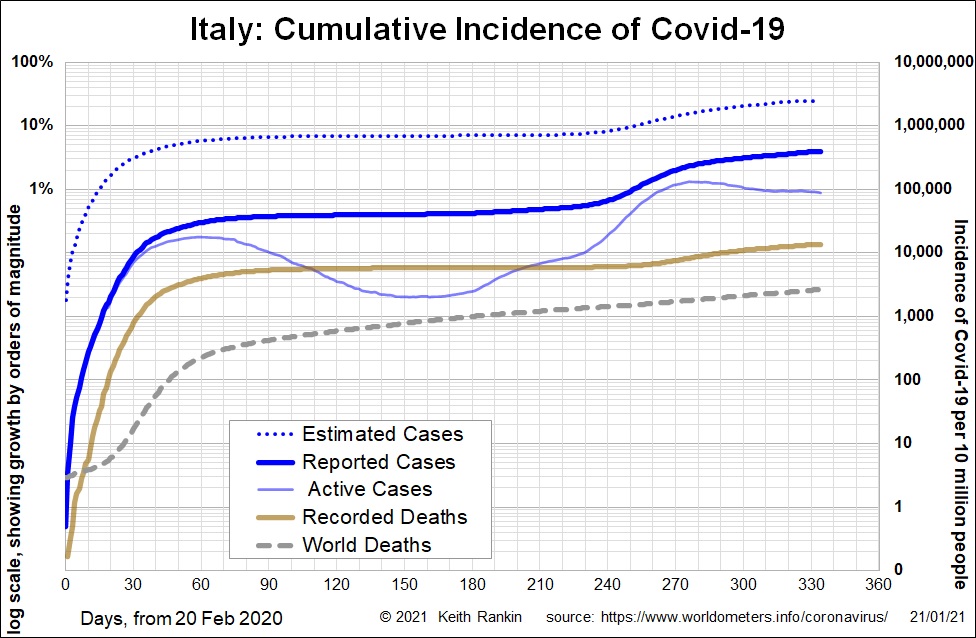
The final pair of charts shows that both countries have had substantially worse death experiences from Covid19 than the world average. 25 percent of Italians have, or have had, Covid19; and 0.15% have died from Covid19. Thanks to Italy’s well reported recovery statistics, this cumulative chart, which uses the logarithmic scale ‘orders of magnitude’, also show’s both the waves of infection that were shown in the previous charts.
The cumulative chart for Brazil shows a substantial delay, compared to Italy. But the Brazilian chart never flattened out. Twenty percent of Brazilians have or have had Covid19. One in a thousand Brazilians (over 200,000 people) have died from Covid19; equivalent to 5,000 deaths in New Zealand. So, even in Brazil, the impact of Covid19 so far has only been about fifteen percent of the impact of the 1918 Black Flu in New Zealand (10,000 deaths at a time in which the New Zealand population was about a million and a half people).
How much worse will Covid19 get in these (and other) countries? It all depends on the effectiveness of the vaccines now available, and whether the virus becomes less lethal as it becomes more virulent (as many viruses have done). My sense is that, say by 2025, and in most countries, those people today who are able to get free annual influenza injections will also be offered free coronavirus injections. These vaccines may even give recipients some protection from the common cold. And that others, mainly younger people, will be exposed routinely to coronaviruses – no longer novel – in much the same way that they are exposed to other seasonal viruses. It will mean that younger people will experience increased incidence of Long Covid, in much the same way that we already accept similar conditions such as ‘Tapanui Flu’ and Glandular Fever.