CoveragePost
November 7, 2025
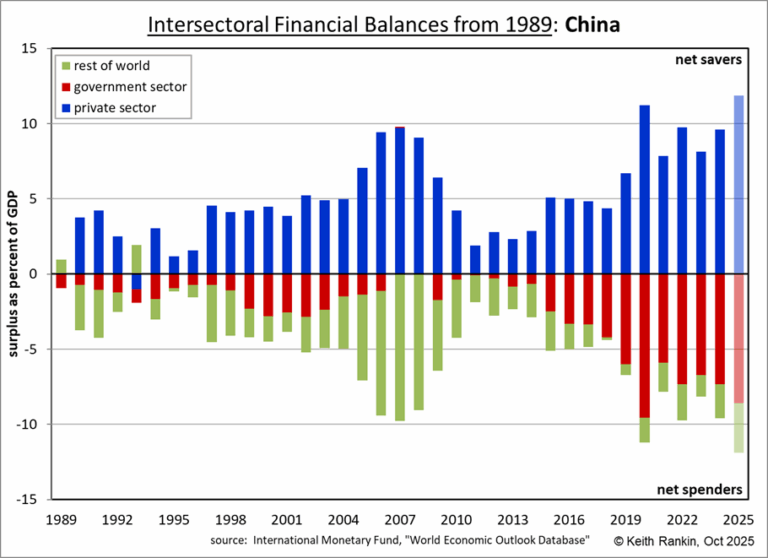
Analysis by Keith Rankin. Are wars affordable? The answer of course is ‘yes and no’. Affording a war is different from financing a war. To make any new thing affordable, either there must be a reallocation of resources or a deployment of resources not otherwise in use. Or a mix of both. Further, resources get ... <a title="Keith Rankin Analysis – Affording and Financing Wars, with reference to the United States" class="read-more" href="https://eveningreport.nz/2025/11/07/keith-rankin-analysis-affording-and-financing-wars-with-reference-to-the-united-states/" aria-label="Read more about Keith Rankin Analysis – Affording and Financing Wars, with reference to the United States">Read more</a>
CoveragePost
October 30, 2025
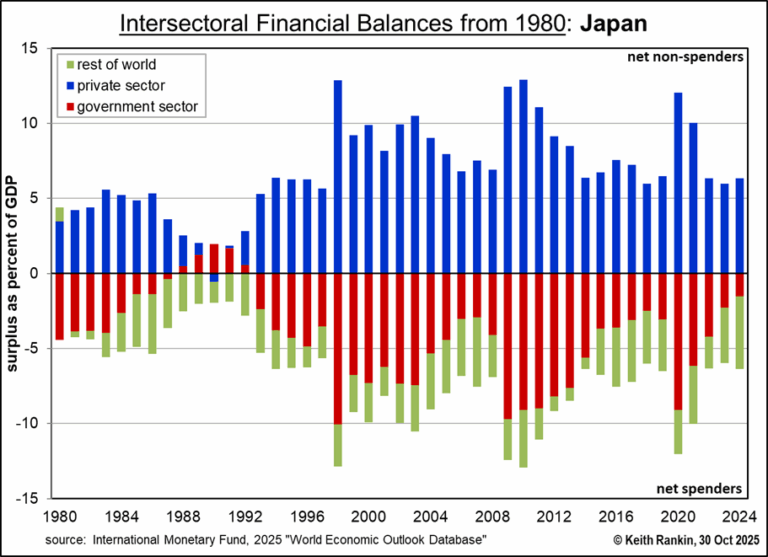
Analysis by Keith Rankin. The chart above summarises Japan’s financial balance sheet since 1980. A wall of red below the line, and blue above. Additionally, a persistent ‘slice’ of green below the line, indicating that Japan – the country, not the government – is very much a creditor (ie saver) nation. This red wall has ... <a title="Keith Rankin Analysis – Red Gold: Japan’s Lesson for the World" class="read-more" href="https://eveningreport.nz/2025/10/30/keith-rankin-analysis-red-gold-japans-lesson-for-the-world/" aria-label="Read more about Keith Rankin Analysis – Red Gold: Japan’s Lesson for the World">Read more</a>
CoveragePost
October 21, 2025
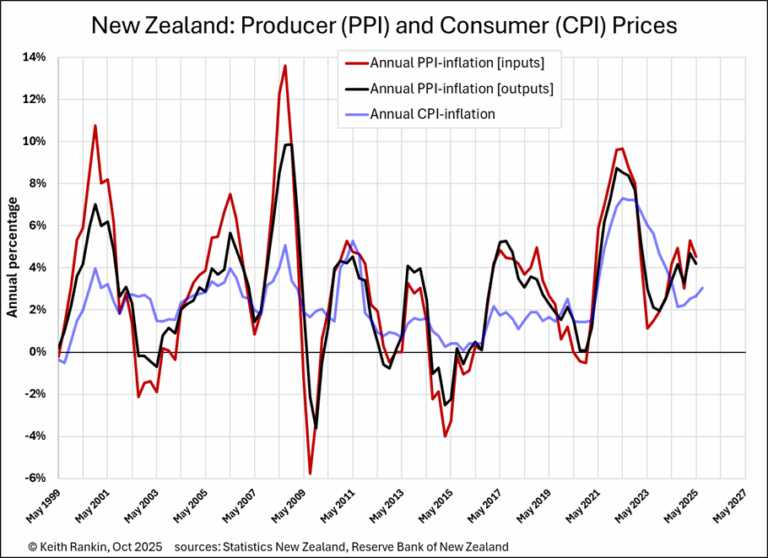
Analysis by Keith Rankin. The first chart shows annual price increases in New Zealand for businesses (PPI: Producers Price Index) and consumers (CPI: Consumers Price Index), since 1999. We note that the latest CPI datapoint is for the third quarter of 2025, meaning that it’s centred on mid-August. The most recent PPI data is for the second ... <a title="Keith Rankin Chart Analysis – The Truth about Prices in New Zealand" class="read-more" href="https://eveningreport.nz/2025/10/21/keith-rankin-chart-analysis-the-truth-about-prices-in-new-zealand/" aria-label="Read more about Keith Rankin Chart Analysis – The Truth about Prices in New Zealand">Read more</a>
CoveragePost
October 13, 2025
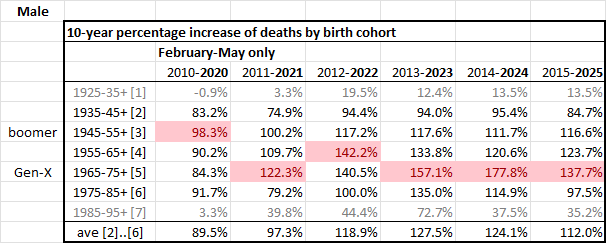
Analysis by Keith Rankin. The following tables represent an update of mortality by sex in relation to Table 2 from Decennial Increases in Deaths by Birth Cohort, in Aotearoa New Zealand. By looking at deaths registered in February to May only, it is possible to extend trends into 2025, avoiding fluctuations arising from winter illnesses. ... <a title="Keith Rankin Chart Analysis – Decennial Increases in Deaths by Birth Cohort, an Update" class="read-more" href="https://eveningreport.nz/2025/10/13/keith-rankin-chart-analysis-decennial-increases-in-deaths-by-birth-cohort-an-update/" aria-label="Read more about Keith Rankin Chart Analysis – Decennial Increases in Deaths by Birth Cohort, an Update">Read more</a>
CoveragePost
September 21, 2025
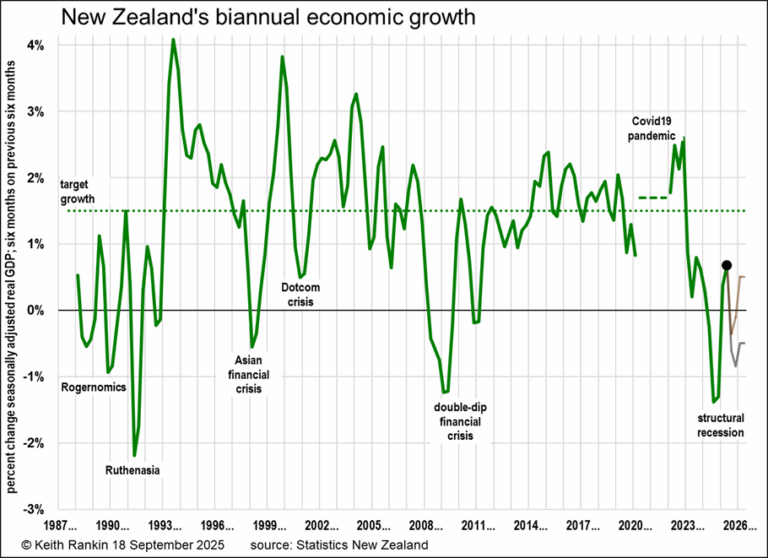
Analysis by Keith Rankin. Yesterday the provisional Quarterly Economic Growth data was released. It showed that, seasonally adjusted, remunerated output (ie GDP, gross domestic product) fell 0.9% in April-to-June compared to January-to-March. While the resulting media hoo-ha overstated the significance of this result, there was still very little coverage of the underlying problem; New Zealand ... <a title="Keith Rankin Chart Analysis – Structural Recession" class="read-more" href="https://eveningreport.nz/2025/09/21/keith-rankin-chart-analysis-structural-recession/" aria-label="Read more about Keith Rankin Chart Analysis – Structural Recession">Read more</a>
CoveragePost
August 8, 2025
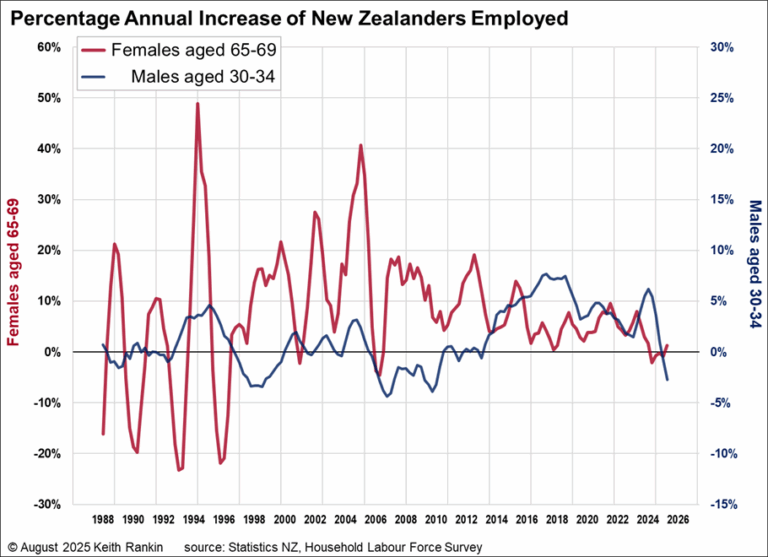
Analysis by Keith Rankin. The above chart shows – in red – the annual percentage increase (since 1988) in numbers employed of women aged 65-69, based on Household Labour Force Survey employment data. (And it shows, for comparison, males aged 30-34; in blue, their percentages are shown on the right-hand side of the chart. I ... <a title="Keith Rankin Chart Analysis – Employment growth in New Zealand for retirement-age women" class="read-more" href="https://eveningreport.nz/2025/08/08/keith-rankin-chart-analysis-employment-growth-in-new-zealand-for-retirement-age-women/" aria-label="Read more about Keith Rankin Chart Analysis – Employment growth in New Zealand for retirement-age women">Read more</a>
CoveragePost
August 7, 2025
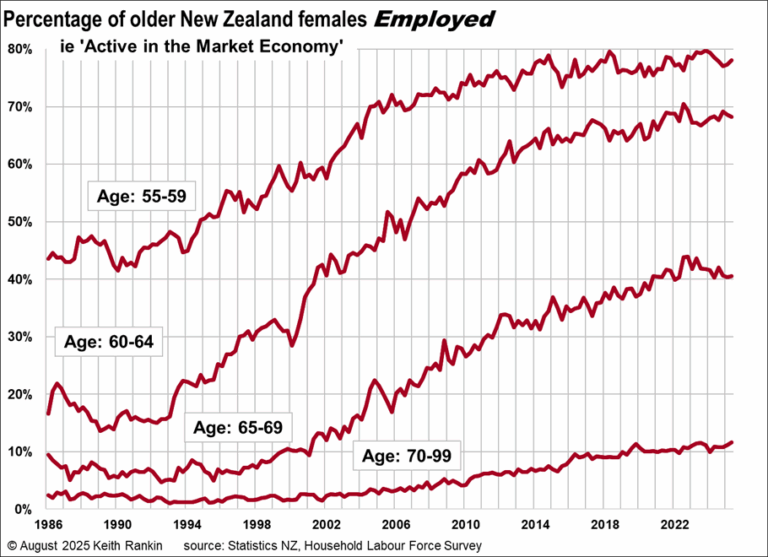
Analysis by Keith Rankin. Quarterly Labour market data in Aotearoa New Zealand was released today. Much of the data is functionally useless, because of definitions which disguise rather than reveal important trends and turning points. I have focussed on employment data (although the definition of ’employment’ is too generous to be optimally useful) relative to ... <a title="Keith Rankin Chart Analysis: Employment in New Zealand – especially of women – at the Age Margins" class="read-more" href="https://eveningreport.nz/2025/08/07/keith-rankin-chart-analysis-employment-in-new-zealand-especially-of-women-at-the-age-margins/" aria-label="Read more about Keith Rankin Chart Analysis: Employment in New Zealand – especially of women – at the Age Margins">Read more</a>
CoveragePost
August 4, 2025
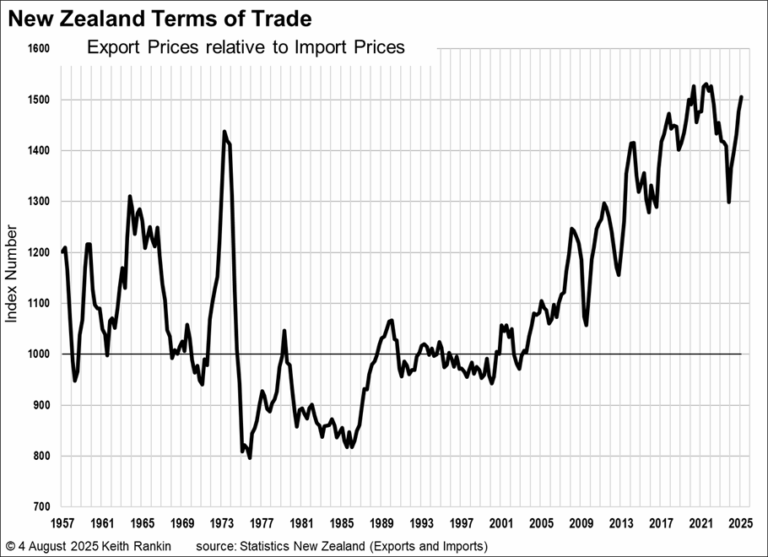
Analysis by Keith Rankin. The most important measure of the favourability or otherwise of the international economic environment is called a country’s ‘Terms of Trade’. This label essentially means ‘barter price’, reflecting that international trade is essentially one country’s barter with the rest of the world. (Digression. We note that such ‘barter’ is rarely the ... <a title="Keith Rankin Analysis – New Zealand’s highly favourable Terms of Trade" class="read-more" href="https://eveningreport.nz/2025/08/04/keith-rankin-analysis-new-zealands-highly-favourable-terms-of-trade/" aria-label="Read more about Keith Rankin Analysis – New Zealand’s highly favourable Terms of Trade">Read more</a>
CoveragePost
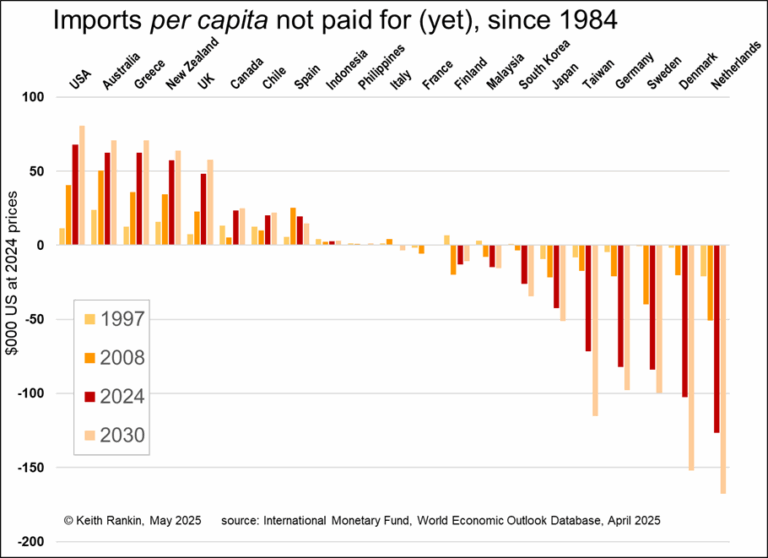
May 8, 2025
Analysis by Keith Rankin. The ‘see-saw’ chart above shows the accumulated ‘excess benefits’ that Aotearoa New Zealand, and a few other countries, have enjoyed from international trade over the last 40 years. These are benefits arising from ‘unbalanced trade’ which are in addition to the regular benefits – arising from efficient specialisation – of ‘balanced’ ... <a title="Keith Rankin Chart Analysis – International Trade over time: gifts with strings" class="read-more" href="https://eveningreport.nz/2025/05/08/keith-rankin-chart-analysis-international-trade-over-time-gifts-with-strings/" aria-label="Read more about Keith Rankin Chart Analysis – International Trade over time: gifts with strings">Read more</a>
CoveragePost
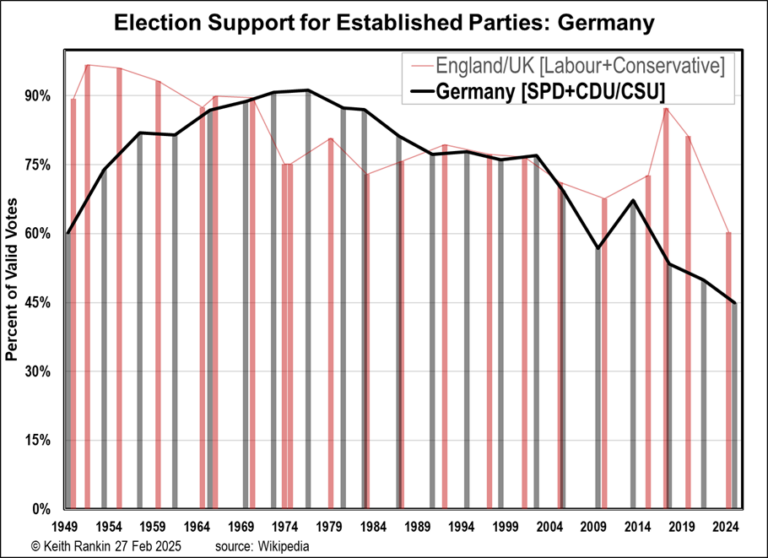
February 27, 2025
Analysis by Keith Rankin. The above chart traces the vote-share of Germany’s establishment political parties: the right-wing CDU/CSU and the now-centre-right SPD (essentially the Christian Democrats, just like National in New Zealand) and the Social Democrats (just like Labour). And it compares Germany with England to show a similar process there. An increasingly stale political centre ... <a title="Keith Rankin Chart Analysis – Germany’s stale (and still pale) political mainstream" class="read-more" href="https://eveningreport.nz/2025/02/27/keith-rankin-chart-analysis-germanys-stale-and-still-pale-political-mainstream/" aria-label="Read more about Keith Rankin Chart Analysis – Germany’s stale (and still pale) political mainstream">Read more</a>
CoveragePost
October 18, 2024
Analysis by Keith Rankin. Recently I have published charts showing how people born around 1960 are already placing huge burdens on New Zealand’s healthcare system (Death Frequencies in Aotearoa New Zealand, by Birth Year, 26 Sep 2024) and how big falls in age-specific death rates have plateaued since 2010, and may now be reversing upwards ... <a title="Keith Rankin Chart Analysis – Decennial Increases in Deaths by Birth Cohort, in Aotearoa New Zealand" class="read-more" href="https://eveningreport.nz/2024/10/18/keith-rankin-chart-analysis-decennial-increases-in-deaths-by-birth-cohort-in-aotearoa-new-zealand/" aria-label="Read more about Keith Rankin Chart Analysis – Decennial Increases in Deaths by Birth Cohort, in Aotearoa New Zealand">Read more</a>
CoveragePost
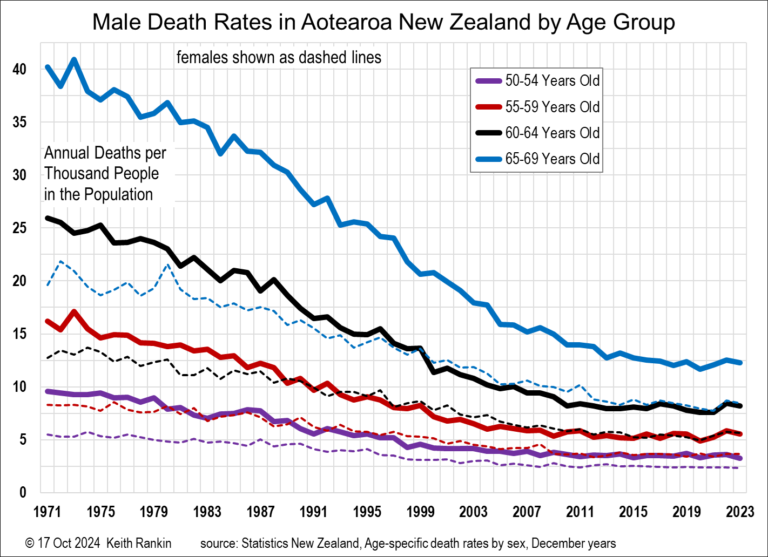
October 17, 2024
Analysis by Keith Rankin. This chart shows how death rates have fallen since the 1970s, emphasising the higher male death experience. The principal finding is that dramatically falling death rates have plateaued since around 2010, especially for men aged 50 to 64. Yet the starkest fact portrayed is the much higher death rates of males ... <a title="Keith Rankin Chart Analysis – Death Rates of Older Working Males in Aotearoa New Zealand, from the late 1970s" class="read-more" href="https://eveningreport.nz/2024/10/17/keith-rankin-chart-analysis-death-rates-of-older-working-males-in-aotearoa-new-zealand-from-the-late-1970s/" aria-label="Read more about Keith Rankin Chart Analysis – Death Rates of Older Working Males in Aotearoa New Zealand, from the late 1970s">Read more</a>