Analysis by Keith Rankin.
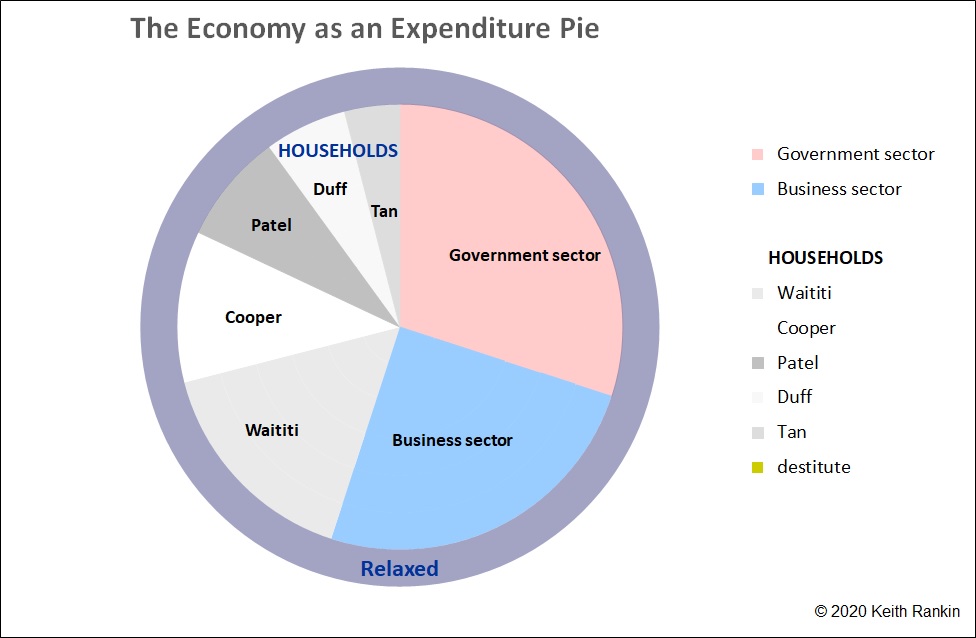
The chart above shows how a spending pie-chart may differ for a closed economy, compared to its income chart. For this example, the government sector has a financial deficit (ie a budget deficit) while the household sector has a financial surplus.
In this case the government sector slice is 30% of the spending pie instead of 25%, meaning that the government is spending 20% more than it is earning in taxes. The government deficit represents 5% of the gross domestic product (GDP, which is the total divided pie). The government deficit is financed by a household sector surplus, which as also 5% of GDP. Households spend less than they are entitled to; they save, which is what households normally choose to do. The only matter of interest is whether it is the business sector or the government sector that runs a deficit to match the household surplus. (In this case, the business sector is running a zero balance.)
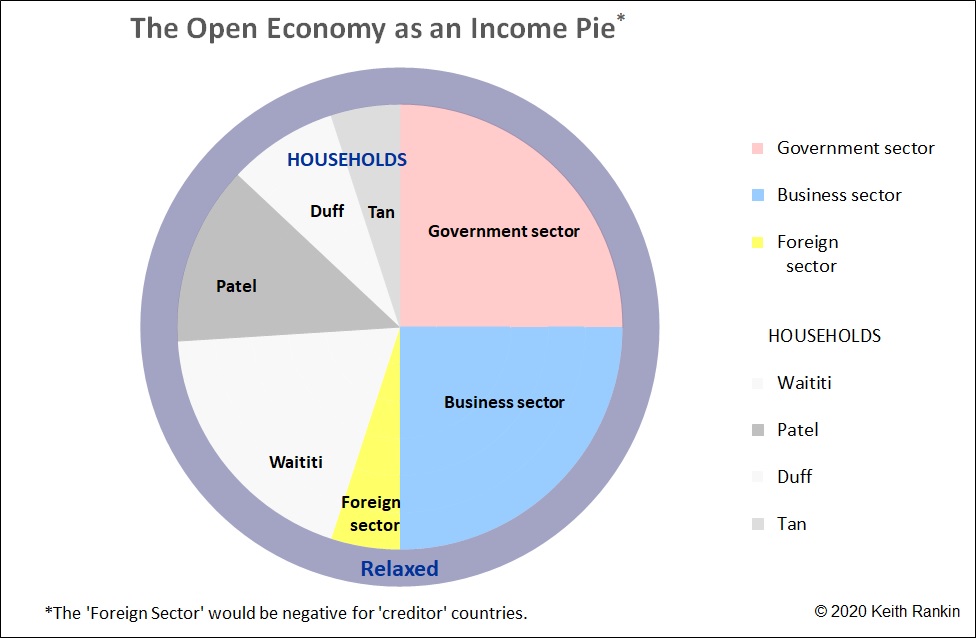
The chart above differs from last week’s chart, by including a foreign sector. The foreign sector can only be depicted for debtor economies (which includes New Zealand and the United Kingdom, but not the European Union). [Pie charts cannot show negative numbers.]
Here, the foreign sector earns 5% of all income generated in this economy. It is a net figure, the difference between what foreigners earn in this economy, and what locals earn in foreign economies. In this example, the whole divided pie is gross domestic product (GDP), and the part that excludes the foreign sector is gross national income (GNI).
If we choose to call this economy New Zealand Inc, then the fact that GNI is less than GDP defines New Zealand Inc as a debtor economy.
New Zealanders may spend more than GNI; indeed they may spend more than GDP even if GNI is less than GDP. This third measure is gross national expenditure (GNE). If GNE is more than GNI, as it almost always is in New Zealand, then the country can be said to be running an external (or current account) deficit. When a country such as New Zealand is running an external deficit, then the country’s foreign sector is running a financial surplus.
For New Zealand, in each of the last few years, the private sector (households and businesses combined) has run a deficit, the government sector has run a surplus, and the foreign sector has run a surplus. While this is a common pattern for New Zealand, it is uncommon for most other countries. Most countries run a private sector surplus most of the time; which means that they typically run government sector deficits and/or foreign sector deficits.
(What may be confusing is that a foreign sector surplus is reported in a country’s national accounts as a current account deficit. When foreigners are net savers, then our country is a net spender. Our country runs a deficit with respect to the rest of the world, and the rest of the world runs a surplus with respect to our country.)
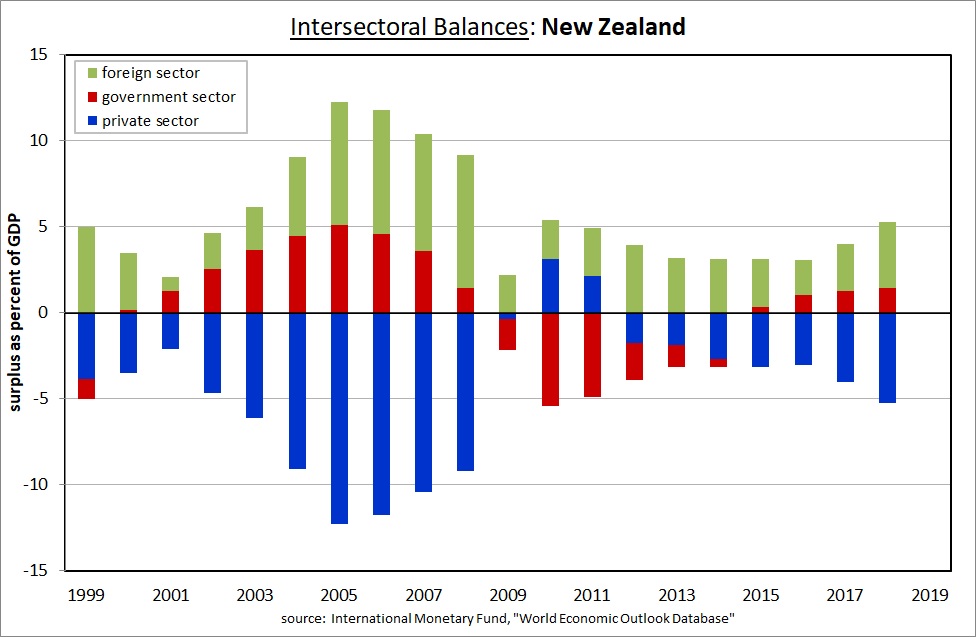
This chart shows that, from 2015, New Zealand has run private sector deficits (ie negative surpluses), government surpluses and foreign surpluses. This has meant that our governments (especially the central government) have spent less than they earned, and foreigners (on average) have spent less than they earned. Households and/or businesses have spent more than they earned (by taking on more debt, or by spending past savings).
This New Zealand pattern was much more striking in the 2000s’ decade, and briefly reversed for a few years after the global financial crisis (GFC).
While New Zealand, as a nation, has benefited from a foreign surplus in every year shown – indeed from every year since 1974 – it does not mean that New Zealand Inc has had unsustainable debt with respect to other countries. What is does mean is that New Zealanders (private sector) have incurred substantial debts that have never been repaid; nevertheless New Zealand Inc remains solvent because it has had no difficulty in servicing its historic debt, and has had no difficulty in extending its historic debt.
(Note that no 2019 data have been given for New Zealand, because the IMF estimates the 2019 government balance by averaging the known balance to the year ending June 2019 with the forecast balance for the year ended June 2020. The forecast for the present financial year is muddied by the Covid19 pandemic.)
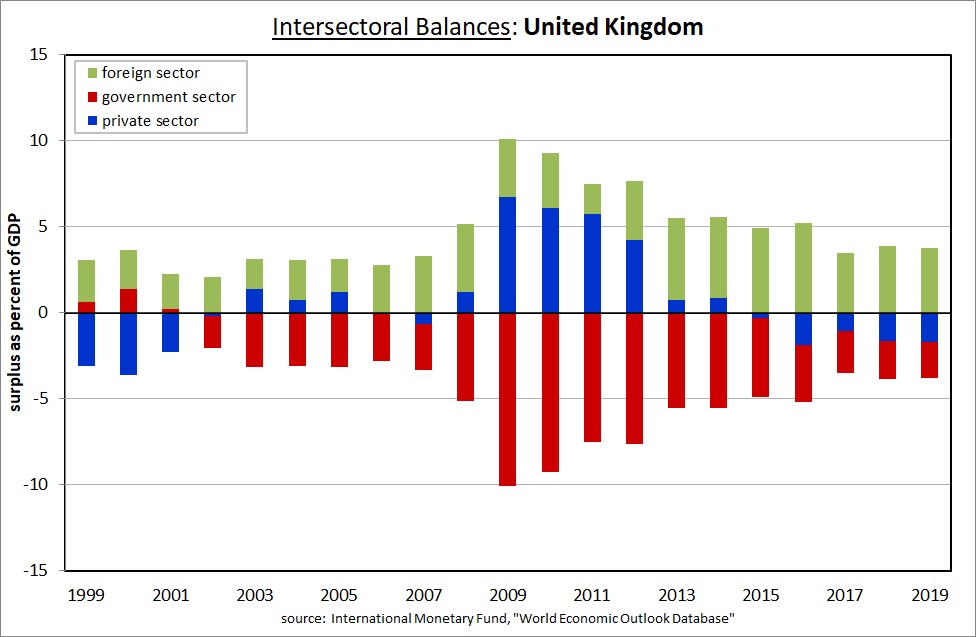
Unlike New Zealand, we can see that the United Kingdom government sector last had a financial surplus in 2001. However, like New Zealand Inc, United Kingdom Inc enjoys the opportunities it has to spend more than it earns. Like New Zealand Inc, United Kingdom Inc is a substantial debtor nation with respect to its foreign sector, and is quite solvent. United Kingdom Inc has faced no requirement to pay back its debt to the rest of the world.
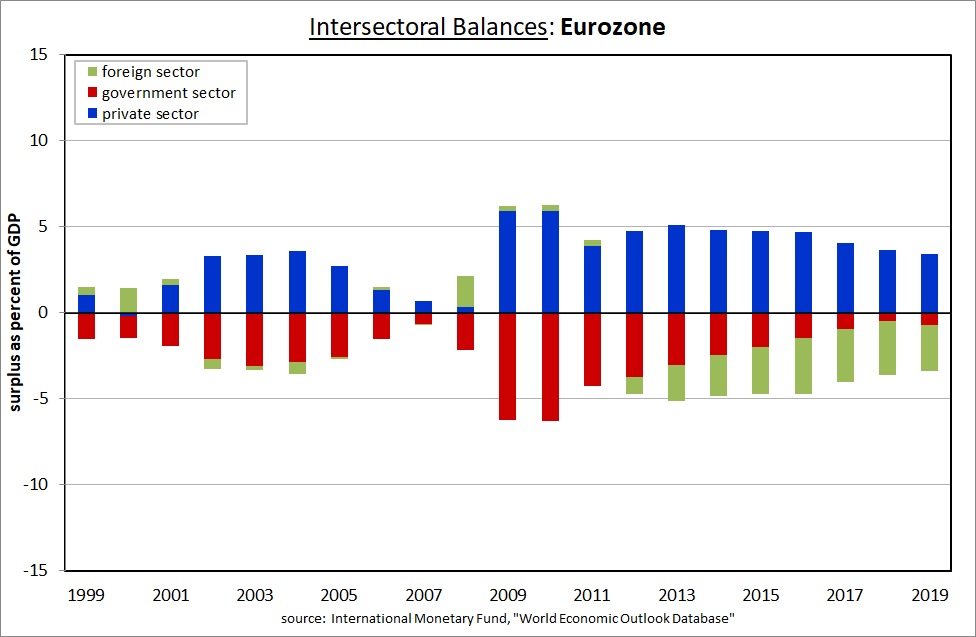
When we look at the Eurozone, which commenced in 1999, we see a very different picture. The private sector has been running surpluses since 2001, and is an important creditor to Eurozone governments. Increasingly, however, the Eurozone private sector has become an important creditor to the rest of its world, including to the private sectors of New Zealand and United Kingdom.
What would the Eurozone private sector do if the private sectors of New Zealand and United Kingdom attempted to repay this debt? It would create all sorts of problems for the Eurozone private sector, which would first try to solve its problem by relending it to New Zealand Inc and United Kingdom Inc. Failing that, it would have to seek out riskier alternative debtors.
The Eurozone is where it is because it is where it wants to be, running foreign sector deficits. If forced to run foreign sector surpluses (ie accept debt repayment), then the Eurozone’s private sector and/or government sector would be forced into running deficits. That’s precisely what the Eurozone people and governments do not want.
If New Zealand and the United Kingdom and the Eurozone are happy to maintain this financial relationship, then there may be no problem to solve. However, there is a problem, and it mainly relates to the Eurozone’s financial relationship with the world’s developing economies.


