Analysis by Keith Rankin

As the public (and many economists) see it, economic growth (growth of Real GDP; marketed economic output) is the principal economic goal of a nation state. Some economists hold a (slightly) more nuanced view – for them it is productivity growth that matters – but when pressed they cannot conceive of productivity growth without economic growth.
This nuance is important. Inputs are costs – including labour inputs – and outputs are benefits. This is true, by definition. And it is the central axiom of economics. Thus labour productivity growth is beneficial, by definition, because benefits (outputs) are growing faster than costs (labour inputs).
Labour productivity growth can come about according to five scenarios. Before considering these, however, we need to note that both measures of labour inputs and economic outputs are contested. It is good to have contested measures, preferably sitting alongside each other. One measure should not displace others.
Contested output concepts:
- Real GDP, a measure of marketed outputs, reflecting purchased goods and services.
- A wider measure, that includes outputs that are not for sale, and that deducts for harm created in the production or consumption of those outputs.
Contested labour input measures:
- Hours of available labour, where labour means paid work.
- Hours of labour worked, again where labour means paid work.
- Hours of work performed, where work means any hour that contributes to the wider measure of output.
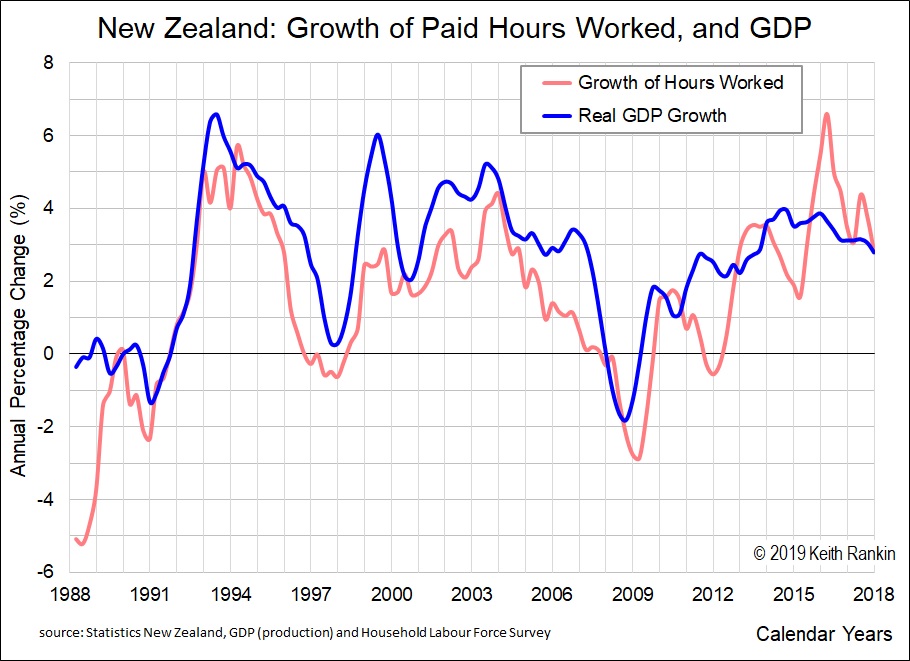
This month’s chart uses the underlined output and input measures: Real GDP and Hours of Labour Worked.
Using these measures, labour productivity growth may mean either of the following scenarios (or types):
- Real GDP increasing, and Hours of Labour Worked increasing; GDP increasing faster.
- Real GDP increasing, and Hours of Labour Worked static.
- Real GDP increasing, and Hours of Labour Worked decreasing.
- Real GDP static, and Hours of Labour Worked decreasing.
- Real GDP decreasing, and Hours of Labour Worked decreasing; Labour decreasing faster.
All five of these productivity growth types represent successful economic outcomes, to an economist. Although, as noted, economists struggle with type 5, which is very much a leisure-preference version.
Most of the public – and most economists – and most elected politicians – strongly favour only the first of these five productivity possibilities. The reason for this is that most of us – possibly even most economists (despite their disciplinary training) – think of Hours of Labour Worked as a benefit rather than as a cost. It’s even enshrined in the Reserve Bank Act – through the most recent Policy Targets Agreement – that it is an economic goal to maximise employment. (Maximising employment is quite different from minimising unemployment, though some people assume that the two are the same.)
Looking at our chart, we see that, for the most part, outputs (dark blue) have been growing faster than labour inputs (light red),with both growing. That’s the productivity growth most economists expect to see. All the periods of negative growth of worked labour are periods of recession or near-recession, when the problem was largely unemployment; high levels of unutilised but available labour.
The public is used to thinking that economic times are good when both blue and red are growing faster than two‑percent per year. Indeed some even think that employment growth (costs) is more important than output growth (benefits). Indeed, this decade, this new unproductivity phenomenon has emerged.
For about half the time the rate of increase of paid labour has exceeded the rate of real GDP growth. In the popular view – that Hours of Labour Worked is a benefit rather than a cost – this looks peculiarly successful. To most economists (with their economist hats on), it’s appalling; since 2012 average productivity growth looks negative.
There are two important messages here to take with us into the 2020s. First – in conventional terms – we are entering unfamiliar territory. This is the non‑productivity growth variant of Productivity Type 1. The last decade of low growth, low inflation and low unemployment was the 1920s; it’s time we learned more about that decade. That’s one message.
The second message is for us to ask how we can move from Productivity Type 1 to any of the other more sustainable productivity scenarios. There are only two ways we can do it without unacceptable levels of inequality.
First, there’s the Japanese way, which is to use debt to fund consumption of the output that is growing when the labour inputs are shrinking. Inequality – and systemic bankruptcies – can be avoided if the government becomes the indebted spending sector, and the government’s creditors are domestic rather than foreign.
Second, societies may distribute capital income – social profit – to all, so that people can spend in excess of their labour wages without incurring excessive household debt. That means a Universal Basic Income (UBI), or at least a system of Public Equity Dividends. A UBI is compatible with all five productivity types.
A sustainable economic future means enabling the possibility of switching away from Productivity Scenario 1 (and its emerging non‑productivity counterpart, as seen from 2012 in the chart). This future can only exist with increasing public debt or increasing public equity or both. The most acceptable future – think Productivity Scenario 4 – requires a full acknowledgement of public equity to be incorporated into capitalist economic thought.
The solution is not to replace traditional measures; GDP will always be an important economic measure, sitting alongside measures that focus on wellbeing rather than marketed output. My conclusion that public equity is a prerequisite to sustainable wellbeing applies, whatever measures we adopt for economic output, and labour input.


