Archive

Gross Domestic Product

CoveragePost

Keith Rankin Chart Analysis – Pandemic as a Catalyst for a New Economic Normal

June 30, 2020

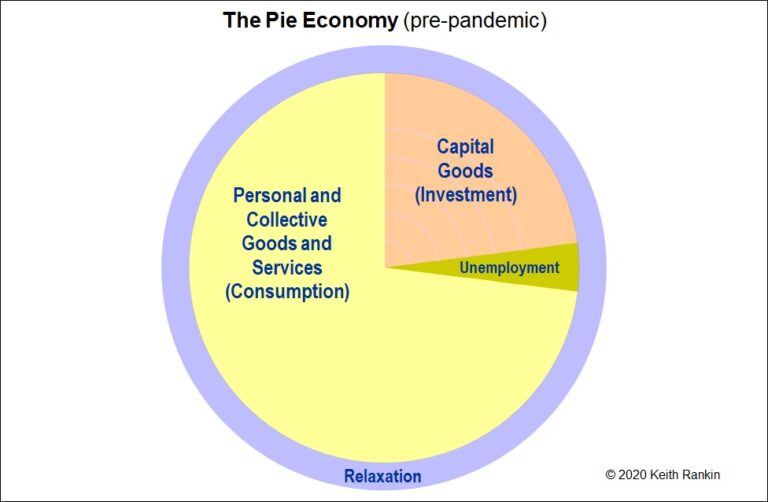
These charts tell a simple story about how the coronavirus pandemic could be a catalyst for the transition to a more sustainable economic future. Looking at Chart 1, the gross domestic product (GDP) of the economy is shown as the combination of yellow and orange. (We note that these charts represent another aspect of pie ... <a title="Keith Rankin Chart Analysis – Pandemic as a Catalyst for a New Economic Normal" class="read-more" href="https://eveningreport.nz/2020/06/30/keith-rankin-chart-analysis-pandemic-as-a-catalyst-for-a-new-economic-normal/" aria-label="Read more about Keith Rankin Chart Analysis – Pandemic as a Catalyst for a New Economic Normal">Read more</a>

CoveragePost

Keith Rankin’s Chart for the Month – Productivity Contradictions

March 27, 2019

Analysis by Keith Rankin As the public (and many economists) see it, economic growth (growth of Real GDP; marketed economic output) is the principal economic goal of a nation state. Some economists hold a (slightly) more nuanced view – for them it is productivity growth that matters – but when pressed they cannot conceive of ... <a title="Keith Rankin’s Chart for the Month – Productivity Contradictions" class="read-more" href="https://eveningreport.nz/2019/03/27/keith-rankins-chart-for-the-month-productivity-contradictions/" aria-label="Read more about Keith Rankin’s Chart for the Month – Productivity Contradictions">Read more</a>