CoveragePost
November 11, 2021
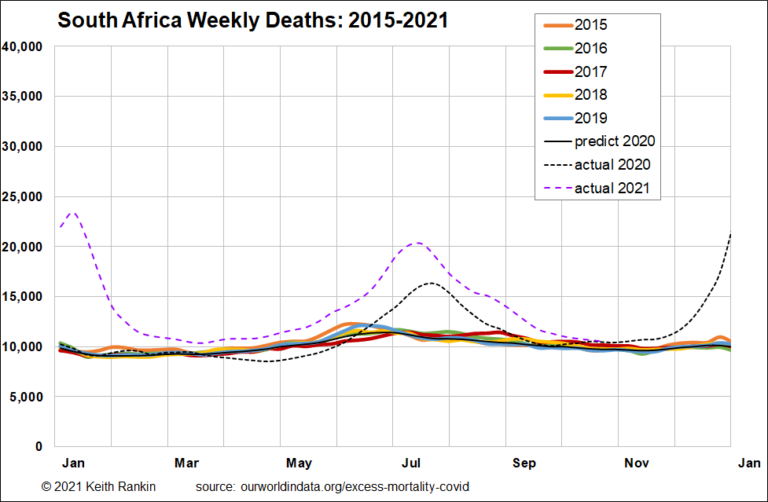
Analysis by Keith Rankin. Today’s five charts are all set to the same scale, allowing for total weekly deaths being four times (300%) above normal. South Africa and Chile are both countries with substantial connections to New Zealand. Most of New Zealand’s pioneering immigrants sailed to New Zealand via Cape Town. And the relationship has ... <a title="Keith Rankin Chart Analysis – Covid19: 2015-2021 Deaths in South Africa and South America" class="read-more" href="https://eveningreport.nz/2021/11/11/keith-rankin-chart-analysis-covid19-2015-2021-deaths-in-south-africa-and-south-america/" aria-label="Read more about Keith Rankin Chart Analysis – Covid19: 2015-2021 Deaths in South Africa and South America">Read more</a>
CoveragePost
November 8, 2021
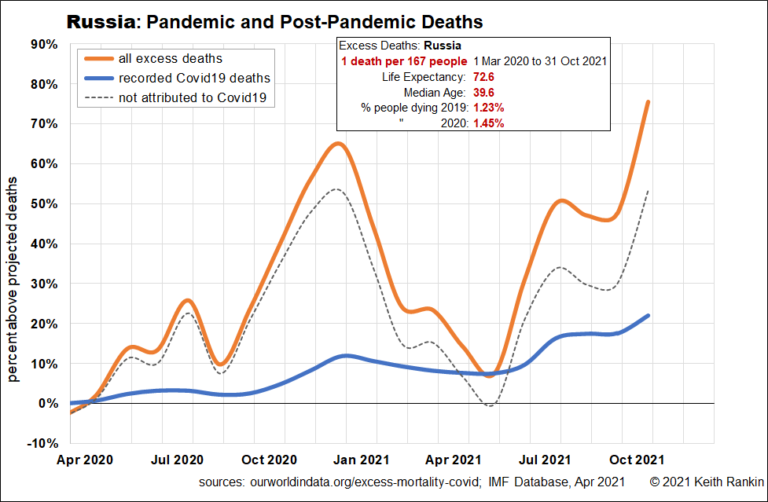
Analysis by Keith Rankin. To be fair to Russia, it is one of the quickest in the world to release its total death data. It is less good about reporting deaths as attributable to Covid19. (See Russia: The nation with half a million secret Covid-19 deaths, NZ Herald, 8 Nov 2021.) Based on the data ... <a title="Keith Rankin Chart Analysis – Russia is First Equal for Covid Deaths per capita" class="read-more" href="https://eveningreport.nz/2021/11/08/keith-rankin-chart-analysis-russia-is-first-equal-for-covid-deaths-per-capita/" aria-label="Read more about Keith Rankin Chart Analysis – Russia is First Equal for Covid Deaths per capita">Read more</a>
CoveragePost
November 2, 2021
Influenza et.al.; charting normal to see Covid19 in context Analysis by Keith Rankin. So much of our analysis of the public health impact of Covid19 has been taken out of context. The officially reported case data are incomplete, and take little account of how these health impacts deviate from normal, or even what ‘normal’ is. ... <a title="Keith Rankin Chart Analysis – Influenza context for covid deaths in selected countries" class="read-more" href="https://eveningreport.nz/2021/11/02/keith-rankin-chart-analysis-influenza-context-for-covid-deaths-in-selected-countries/" aria-label="Read more about Keith Rankin Chart Analysis – Influenza context for covid deaths in selected countries">Read more</a>
CoveragePost
October 30, 2021
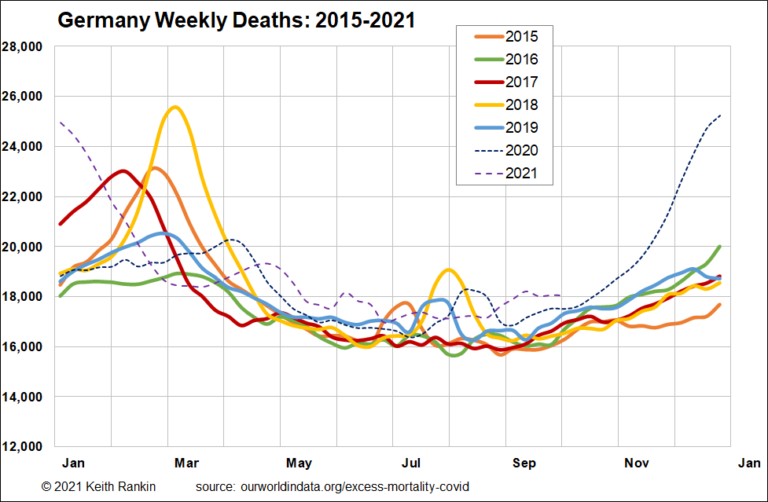
Analysis by Keith Rankin. The first chart shows excess deaths in Germany for every year from 2015. (The chart is essentially the one that can be found here, on the Our World in Data website, though it uses three-period moving averages to smooth out some of the ‘random noise’ that inevitably accompanies such time-series data. ... <a title="Keith Rankin Chart Analysis – Covid19 deaths, the German case" class="read-more" href="https://eveningreport.nz/2021/10/30/keith-rankin-chart-analysis-covid19-deaths-the-german-case/" aria-label="Read more about Keith Rankin Chart Analysis – Covid19 deaths, the German case">Read more</a>
CoveragePost
October 27, 2021
Analysis by Keith Rankin. These charts are of the type that I have published approximately monthly. Last time, three weeks ago, the key covid places were clearly the Caribbean and the Balkans. This time, while these two regions are important pandemic sites, there is clearly a new outbreak beginning in the European Union, starting from ... <a title="Keith Rankin Chart Analysis – Covid19: Latest Outbreaks" class="read-more" href="https://eveningreport.nz/2021/10/27/keith-rankin-chart-analysis-covid19-latest-outbreaks/" aria-label="Read more about Keith Rankin Chart Analysis – Covid19: Latest Outbreaks">Read more</a>
CoveragePost
October 26, 2021
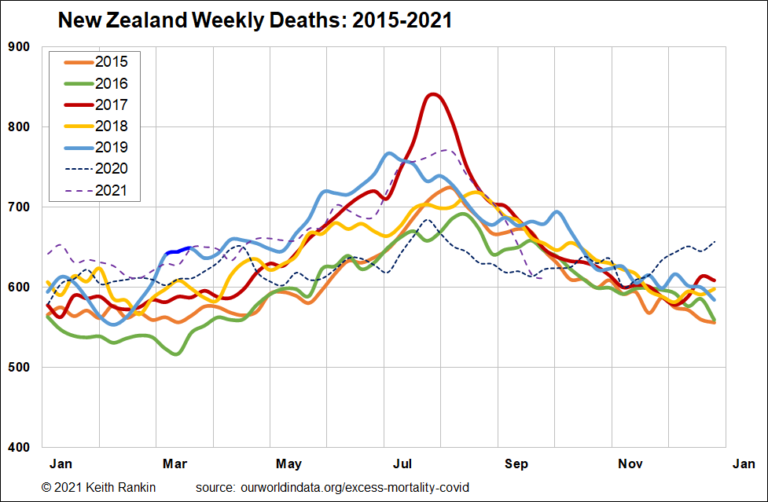
Analysis by Keith Rankin. The above chart of New Zealand weekly deaths since 2015 clearly shows the impact of winter influenzas and pneumonias on the mortality landscape of New Zealand. 2017 was a particularly bad year, with a substantially increased mortality in July of that year. 2016 was a particularly good year for mortality in ... <a title="Keith Rankin Chart Analysis – Covid19 and its impact so far on New Zealand Mortality" class="read-more" href="https://eveningreport.nz/2021/10/26/keith-rankin-chart-analysis-covid19-and-its-impact-so-far-on-new-zealand-mortality/" aria-label="Read more about Keith Rankin Chart Analysis – Covid19 and its impact so far on New Zealand Mortality">Read more</a>
CoveragePost
October 20, 2021
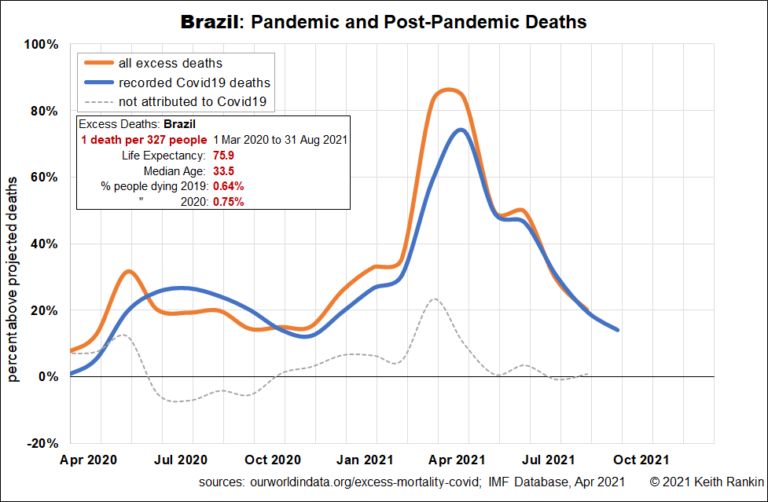
Analysis by Keith Rankin. These charts give an insight into the actual impact – and progression – of Covid19 in South and Central America. As for the previously posted charts showing Russia, and showing the Middle East, these countries are included because they report their overall mortality monthly rather than weekly. Brazil Brazil received more ... <a title="Keith Rankin Chart Analysis – Covid19 Impact: Excess deaths in Latin America" class="read-more" href="https://eveningreport.nz/2021/10/20/keith-rankin-chart-analysis-covid19-impact-excess-deaths-in-latin-america/" aria-label="Read more about Keith Rankin Chart Analysis – Covid19 Impact: Excess deaths in Latin America">Read more</a>
CoveragePost
October 15, 2021
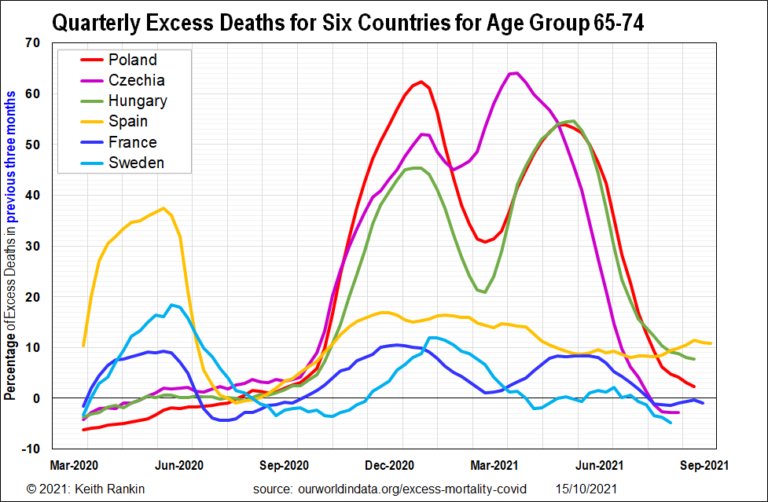
Analysis by Keith Rankin. The above chart poses one clear question. Why is the experience of the three relatively prosperous East European EU countries (Poland, Czechia, Hungary) different to that of the three West European EU countries (Spain, France, Sweden). The ‘research hypothesis’ posed here is that, while all these countries were naïve to the ... <a title="Keith Rankin Chart Analysis – Covid19 Immunity Hypothesis: The European Union before the Variants and the Vaccines" class="read-more" href="https://eveningreport.nz/2021/10/15/keith-rankin-chart-analysis-covid19-immunity-hypothesis-the-european-union-before-the-variants-and-the-vaccines/" aria-label="Read more about Keith Rankin Chart Analysis – Covid19 Immunity Hypothesis: The European Union before the Variants and the Vaccines">Read more</a>
CoveragePost
October 12, 2021
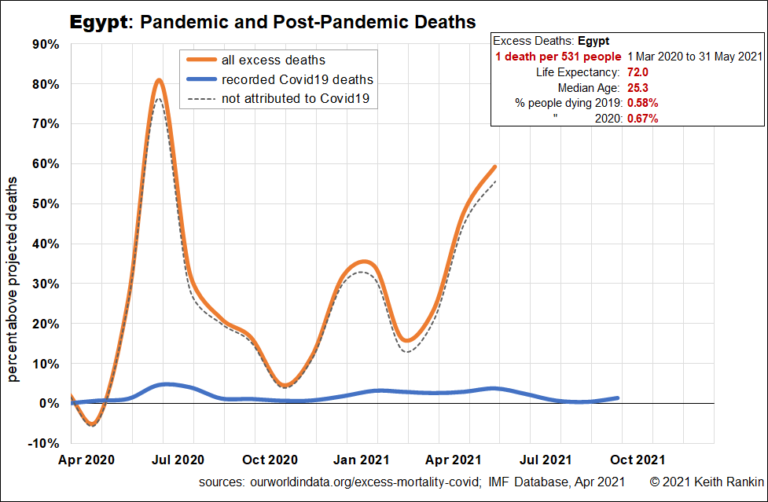
Analysis Keith Rankin, 12 Oct 2021 Egypt is the world’s 14th largest country by population. It’s the one of the only two African countries on the ourworldindata database. It’s also a major travel destination. The excess deaths data reveals that Egypt has suffered far worse from the Covid19 pandemic than the official reported data indicates, ... <a title="Keith Rankin Analysis – Covid19 Impact: Four Middle-East Countries" class="read-more" href="https://eveningreport.nz/2021/10/12/keith-rankin-analysis-covid19-impact-four-middle-east-countries/" aria-label="Read more about Keith Rankin Analysis – Covid19 Impact: Four Middle-East Countries">Read more</a>
CoveragePost
October 8, 2021
Analysis by Keith Rankin. Russia is a former superpower with a long tradition of scientific achievement. It remains the world’s second largest nuclear power. Yet pre-covid life expectancy in Russia was just 72.6, and Russia has a higher median population than New Zealand, despite having comparatively few people aged over 80. The Russian people have ... <a title="Covid19 Impact: Four Countries of Interest Russia, Serbia, Ireland, Japan" class="read-more" href="https://eveningreport.nz/2021/10/08/covid19-impact-four-countries-of-interest-russia-serbia-ireland-japan/" aria-label="Read more about Covid19 Impact: Four Countries of Interest Russia, Serbia, Ireland, Japan">Read more</a>
CoveragePost
October 6, 2021
Analysis by Keith Rankin. The first thing to note – some good news – is that the sixth wave of Covid19 is on the wane. For the first wave, see https://www.worldometers.info/coronavirus/country/china/. In particular, look at ‘Active Cases’ in China. For the following five waves of Covid19, see https://www.worldometers.info/coronavirus/. In particular, look at World ‘Daily Deaths’. ... <a title="Keith Rankin Chart Analysis – Covid19 Global Clusters at the end of September 2021" class="read-more" href="https://eveningreport.nz/2021/10/06/keith-rankin-chart-analysis-covid19-global-clusters-at-the-end-of-september-2021/" aria-label="Read more about Keith Rankin Chart Analysis – Covid19 Global Clusters at the end of September 2021">Read more</a>
CoveragePost
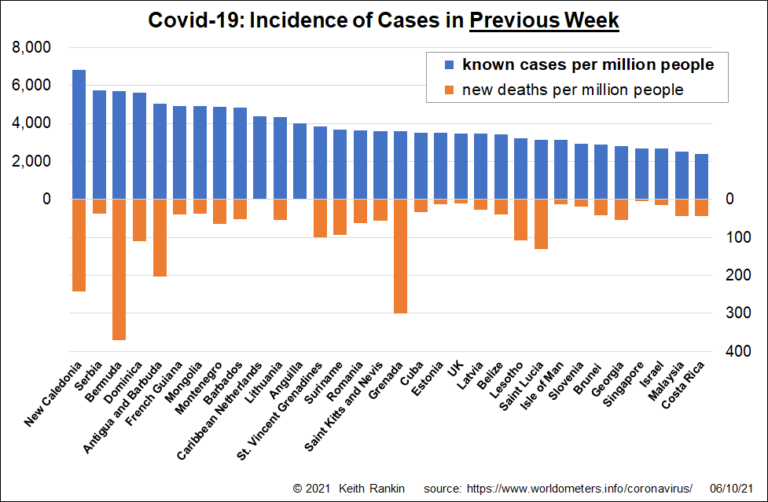
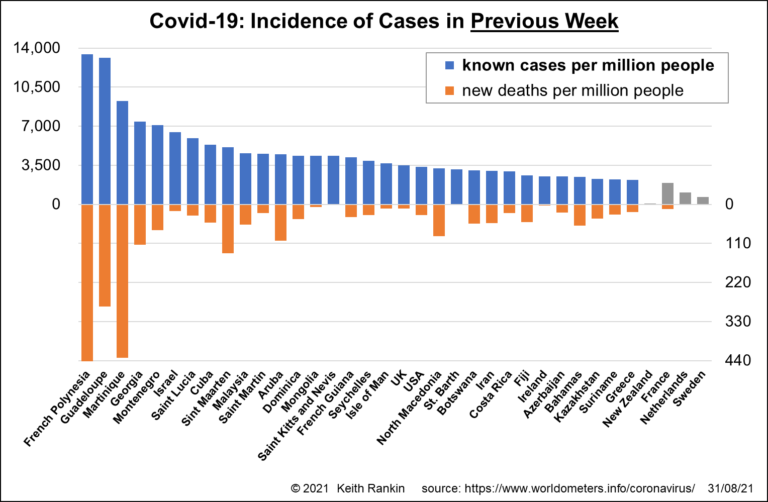
September 1, 2021
Analysis by Keith Rankin. The first two charts show official case numbers and deaths, for all countries, including the little countries that tend to dominate in the peak of the northern summer holiday season. Chart 1 shows the countries with the highest case numbers per person – from French Polynesia (Tahiti) to Greece, plus four ... <a title="Keith Rankin Chart Analysis – Covid19: State of the World at the end of August 2021" class="read-more" href="https://eveningreport.nz/2021/09/01/keith-rankin-chart-analysis-covid19-state-of-the-world-at-the-end-of-august-2021/" aria-label="Read more about Keith Rankin Chart Analysis – Covid19: State of the World at the end of August 2021">Read more</a>