CoveragePost
November 27, 2020
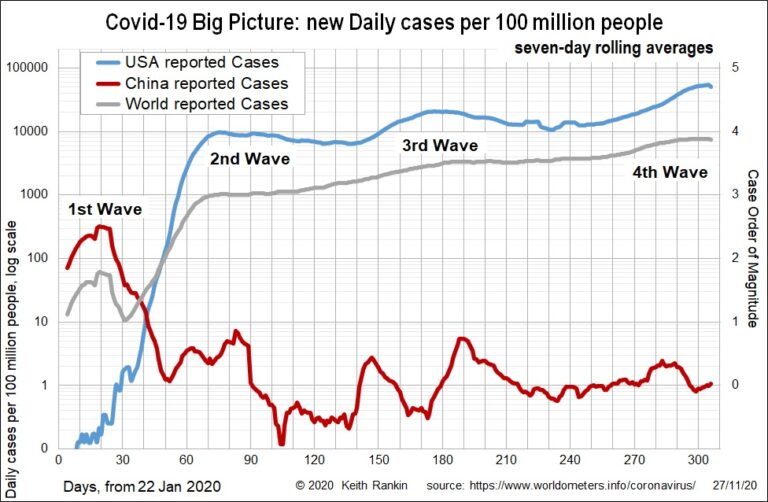
Analysis by Keith Rankin. This week’s charts extend the period covered to January 2020, when almost all recorded cases were in China. Cases came into other countries in late January, including the United States in dribs and drabs, and were largely contained. All this changed with the European outbreak in mid-February. Thus, the First Wave ... <a title="Keith Rankin Chart Analysis: Covid-19: Orders of Magnitude – USA vs. China, World" class="read-more" href="https://eveningreport.nz/2020/11/27/keith-rankin-chart-analysis-covid-19-orders-of-magnitude-usa-vs-china-world/" aria-label="Read more about Keith Rankin Chart Analysis: Covid-19: Orders of Magnitude – USA vs. China, World">Read more</a>
CoveragePost
November 20, 2020
Analysis by Manqing Cheng – Doctoral Researcher in Politics and International Relations at University of Auckland. This is Manging’s first analysis for EveningReport.nz. Precis: This article takes the WHO as an example to examine the difficulties for some international organizations in playing their due roles and tackling with the security threats of international concern such ... <a title="INDEPTH: The Plight of International Organizations in Addressing Public Health Emergency of International Concern and the Implications for Global Governance" class="read-more" href="https://eveningreport.nz/2020/11/20/indepth-the-plight-of-international-organizations-in-addressing-public-health-emergency-of-international-concern-and-the-implications-for-global-governance/" aria-label="Read more about INDEPTH: The Plight of International Organizations in Addressing Public Health Emergency of International Concern and the Implications for Global Governance">Read more</a>
CoveragePost
November 18, 2020
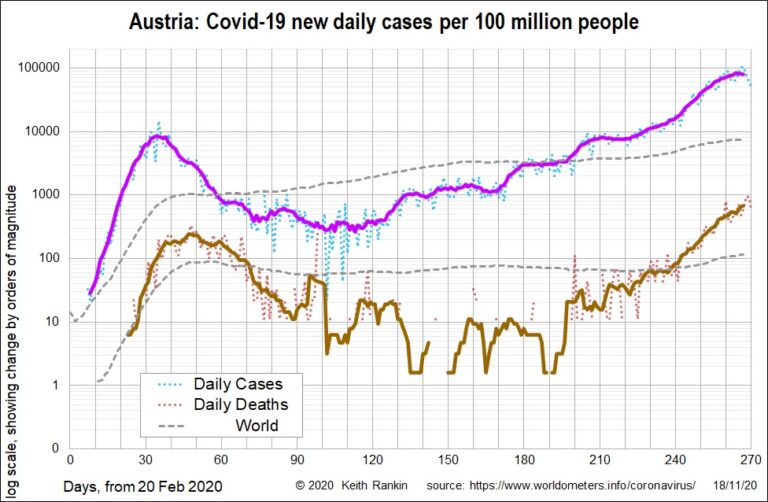
Analysis by Keith Rankin. Today I have chosen six countries, each with Covid19 case experiences over the last three weeks (days 250 to 270) that are orders of magnitude apart. A country with 1,000 daily cases per 100 million people is classed as magnitude three; that’s three zeros after the ‘one’. A country with 1 ... <a title="Keith Rankin Chart Analysis – Covid-19: Orders of Magnitude" class="read-more" href="https://eveningreport.nz/2020/11/18/keith-rankin-chart-analysis-covid-19-orders-of-magnitude/" aria-label="Read more about Keith Rankin Chart Analysis – Covid-19: Orders of Magnitude">Read more</a>
CoveragePost
November 16, 2020
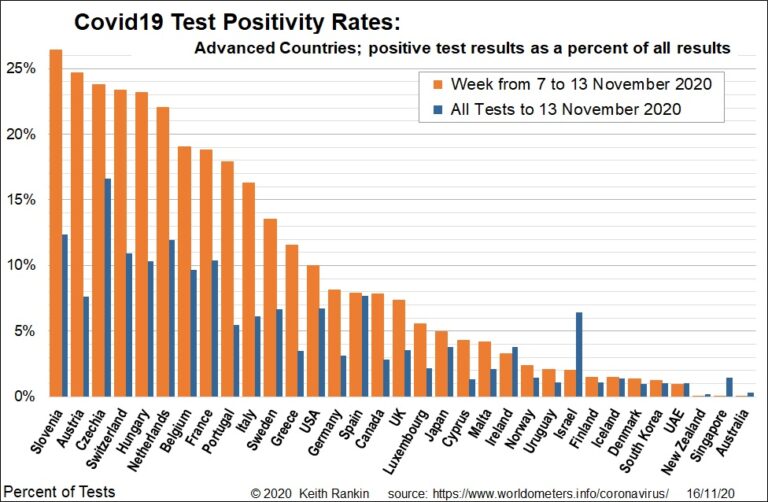
Analysis by Keith Rankin. The above chart shows the world’s most economically developed countries, including three of the most developed in Eastern Europe (Slovenia, Hungary and Czechia), and one of the most developed in South America (Uruguay). In early November, the countries with the most positive results are all clustered around Austria, in central Europe. ... <a title="Keith Rankin Chart Analysis – Test Positivity Rates are a Measure of a Country’s Covid-19 Outbreak" class="read-more" href="https://eveningreport.nz/2020/11/16/keith-rankin-chart-analysis-test-positivity-rates-are-a-measure-of-a-countrys-covid-19-outbreak/" aria-label="Read more about Keith Rankin Chart Analysis – Test Positivity Rates are a Measure of a Country’s Covid-19 Outbreak">Read more</a>
CoveragePost
October 30, 2020
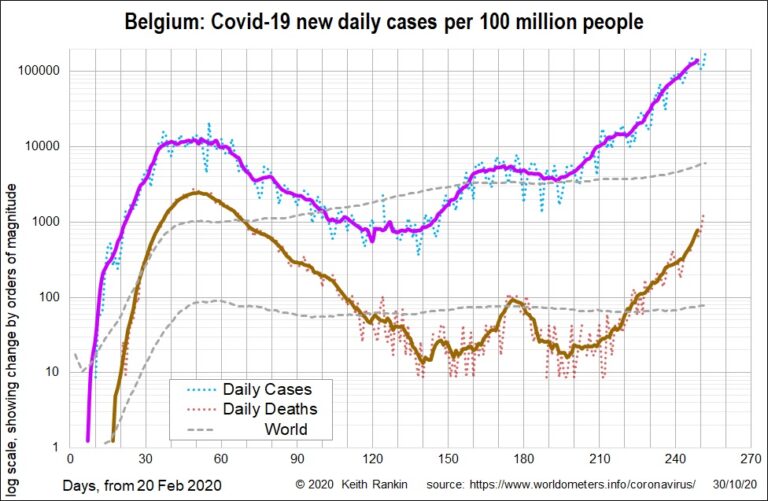
Analysis by Keith Rankin. This week’s charts show three small economically prosperous European countries with similar populations; Belgium has 11.6 million people, Switzerland 8.6 million, and Sweden has 10.1 million. Belgium has the third highest per capita death toll in the world from Covid-19; only Peru and little San Marino have had more deaths. Belgium got ... <a title="Keith Rankin Chart Analysis – Covid-19: Belgium, Switzerland and Sweden" class="read-more" href="https://eveningreport.nz/2020/10/30/keith-rankin-chart-analysis-covid-19-belgium-switzerland-and-sweden/" aria-label="Read more about Keith Rankin Chart Analysis – Covid-19: Belgium, Switzerland and Sweden">Read more</a>
CoveragePost
October 20, 2020
Opinion by By Armida Salsiah Alisjahbana and Chihoko Asada Miyakawa In the fight against COVID-19, success has so far been defined by responses in Asia and the Pacific. Many countries in our region have been hailed as reference points in containing the virus. Yet if the region is to build back better, the success of immediate ... <a title="Op-Ed: Enhanced social protection an opportunity Asia Pacific must grasp" class="read-more" href="https://eveningreport.nz/2020/10/20/op-ed-enhanced-social-protection-an-opportunity-asia-pacific-must-grasp/" aria-label="Read more about Op-Ed: Enhanced social protection an opportunity Asia Pacific must grasp">Read more</a>
CoveragePost
October 16, 2020
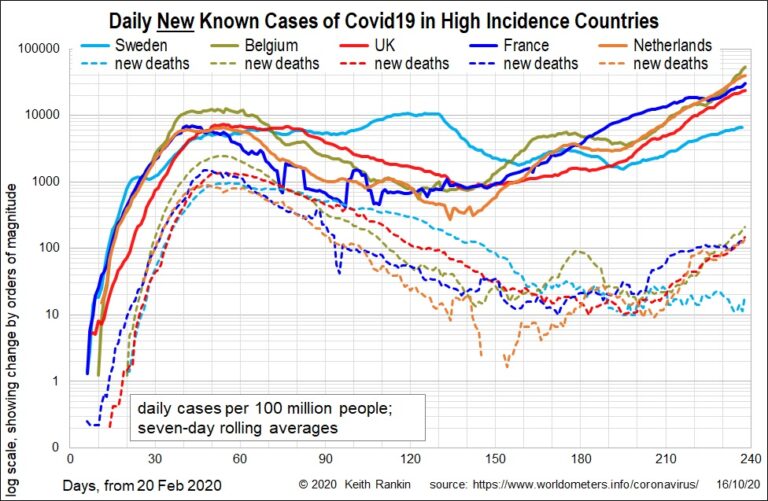
Analysis by Keith Rankin. This week’s first chart looks at a familiar island country with the same population as New Zealand. The chart shows daily cases at the top, and daily deaths at the bottom; and it includes world averages for comparison. The most striking recent feature on the Ireland chart is the straight-line (exponential) growth ... <a title="Keith Rankin Chart Analysis – Covid-19: New European Outbreak" class="read-more" href="https://eveningreport.nz/2020/10/16/keith-rankin-chart-analysis-covid-19-new-european-outbreak/" aria-label="Read more about Keith Rankin Chart Analysis – Covid-19: New European Outbreak">Read more</a>
CoveragePost
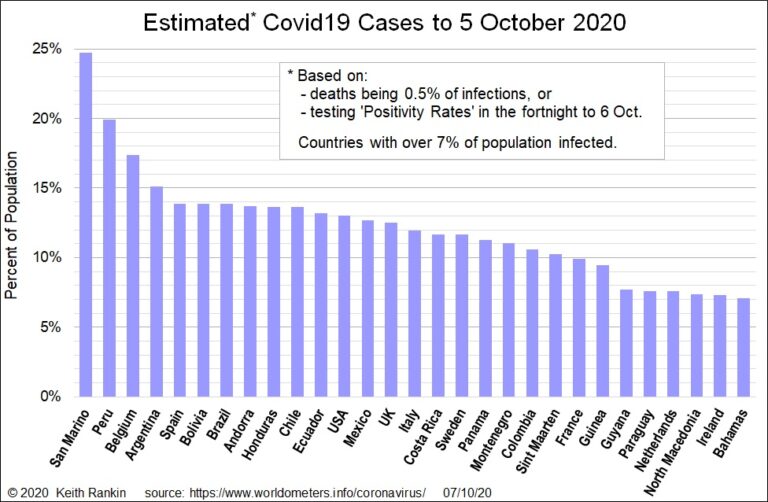
October 8, 2020
Analysis by Keith Rankin. This week the World Health Organisation (WHO) suggested that ten percent of the world’s population may have been infected with Covid19. While my estimates fall well short of this number for the world as a whole, they certainly show many countries with higher infection rates to date than ten percent. The ... <a title="Keith Rankin Chart Analysis: Covid-19 Case Estimates" class="read-more" href="https://eveningreport.nz/2020/10/08/keith-rankin-chart-analysis-covid-19-case-estimates/" aria-label="Read more about Keith Rankin Chart Analysis: Covid-19 Case Estimates">Read more</a>
CoveragePost
September 18, 2020
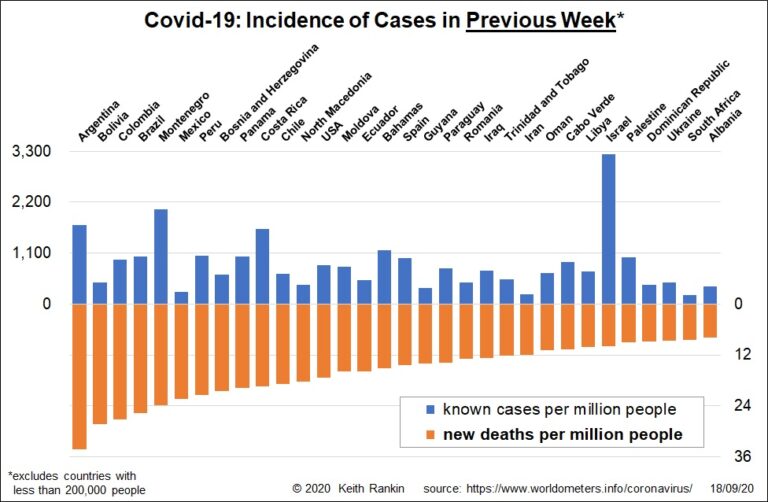
Analysis by Keith Rankin. In mid-September, new cases of Covid19 are higher than they have ever been. (See here for previous weekly charts, which included the ‘little’ countries.) While this still-rising incidence is partly due to more testing, it is also due to significant new outbreaks in the Levant (Israel, Palestine, Lebanon) and in Europe. ... <a title="Keith Rankin Chart Analysis – Covid-19 in mid-September: New Cases, Worst Cases" class="read-more" href="https://eveningreport.nz/2020/09/18/keith-rankin-chart-analysis-covid-19-in-mid-september-new-cases-worst-cases/" aria-label="Read more about Keith Rankin Chart Analysis – Covid-19 in mid-September: New Cases, Worst Cases">Read more</a>
CoveragePost
September 11, 2020
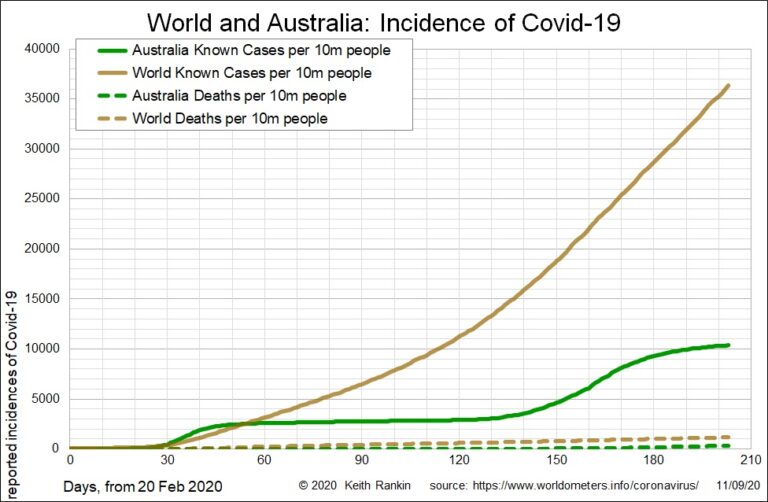
Analysis by Keith Rankin. The first chart shows the growth of Covid19 in Australia using an arithmetic scale. This means the axis labels on the left increase by a given number of cases; in this chart it is increments of 5,000 cases per 10 million people. Australia is currently sitting on just over 10,000 cases ... <a title="Keith Rankin Chart Analysis – Covid-19: Australia to Scale" class="read-more" href="https://eveningreport.nz/2020/09/11/keith-rankin-chart-analysis-covid-19-australia-to-scale/" aria-label="Read more about Keith Rankin Chart Analysis – Covid-19: Australia to Scale">Read more</a>
CoveragePost
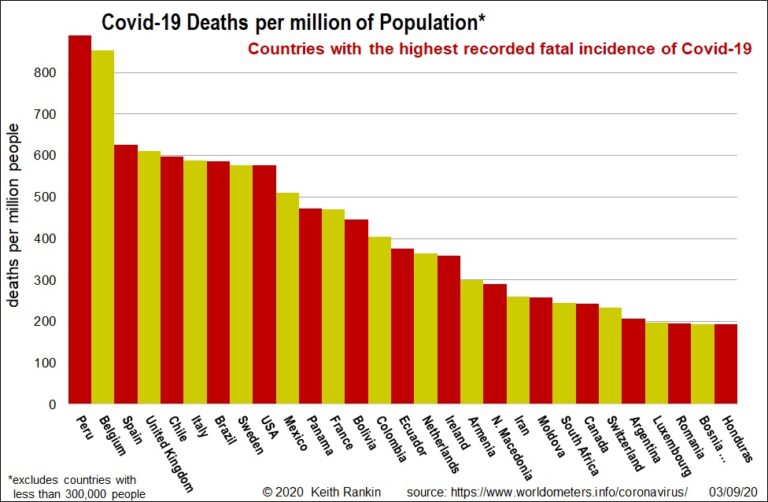
September 4, 2020
Analysis by Keith Rankin. Since its first death (in China) in January, 873 thousand people worldwide have died from Covid19. The chart shows the population-adjusted death tolls for the most-affected countries (excluding countries with less than 300,000 people. (San Marino – with 34,000 people – actually has the highest death rate.) In recent days, Peru ... <a title="Keith Rankin Chart Analysis – Covid-19: Countries with most Deaths and Cases to date" class="read-more" href="https://eveningreport.nz/2020/09/04/keith-rankin-chart-analysis-covid-19-countries-with-most-deaths-and-cases-to-date/" aria-label="Read more about Keith Rankin Chart Analysis – Covid-19: Countries with most Deaths and Cases to date">Read more</a>
CoveragePost
August 28, 2020
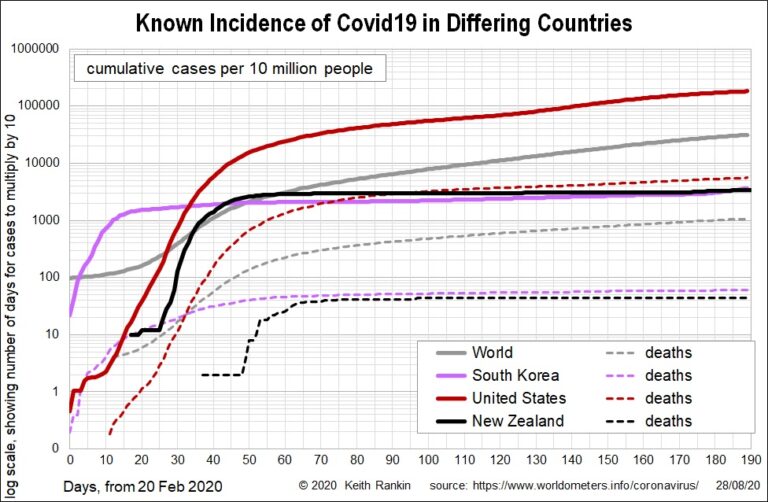
Analysis by Keith Rankin. Global variation These two charts show Covid19 incidence in the world as a whole, in an American country (USA), an Asian country (South Korea), and New Zealand. The first chart shows cumulative cases, with the United States being about six times worse (close to an order of magnitude, which usually means ... <a title="Keith Rankin Chart Analysis – Covid19 towards the end of August 2020" class="read-more" href="https://eveningreport.nz/2020/08/28/keith-rankin-chart-analysis-covid19-towards-the-end-of-august-2020/" aria-label="Read more about Keith Rankin Chart Analysis – Covid19 towards the end of August 2020">Read more</a>