CoveragePost
March 26, 2020
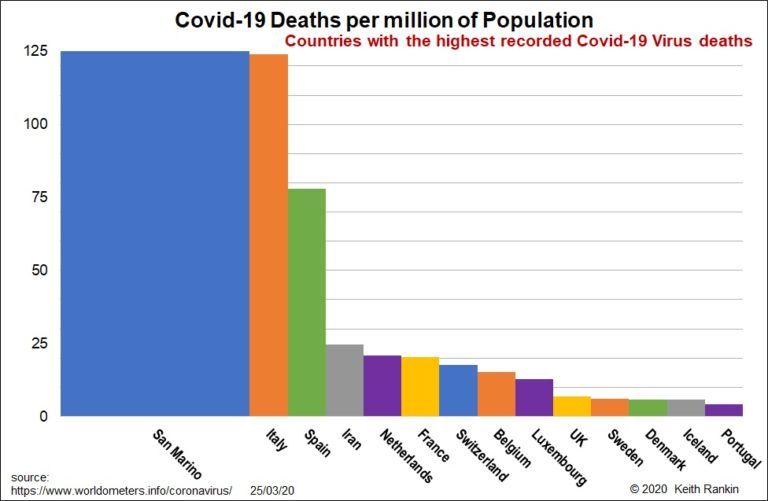
Analysis by Keith Rankin In today’s first chart, which excludes countries with a single death, only Iran features as a country outside of Western Europe. In Europe, worst hit is the ‘Latin’ group in the southwest. I include Switzerland here, which has large Italian‑speaking and French‑speaking components. Next are the Benelux countries – Netherlands, Belgium ... <a title="Keith Rankin Chart Analysis – Covid-19 Virus: Countries with Highest Death Rates" class="read-more" href="https://eveningreport.nz/2020/03/26/keith-rankin-chart-analysis-covid-19-virus-countries-with-highest-death-rates/" aria-label="Read more about Keith Rankin Chart Analysis – Covid-19 Virus: Countries with Highest Death Rates">Read more</a>
CoveragePost
March 25, 2020
By Keith Rankin I keep hearing rather unfortunate ‘expert’ comments in response to questions asked about Universal Basic Income (UBI) as a way of responding to the Covid‑19 economic contraction. These comments all relate to a ‘straw man’ concept of UBI that is obviously unaffordable and impractical. It is not possible to offer any kind ... <a title="Economics: Keith Rankin on Universal Basic Income and Covid‑19" class="read-more" href="https://eveningreport.nz/2020/03/25/economics-keith-rankin-on-universal-basic-income-and-covid%e2%80%9119/" aria-label="Read more about Economics: Keith Rankin on Universal Basic Income and Covid‑19">Read more</a>
CoveragePost
March 25, 2020
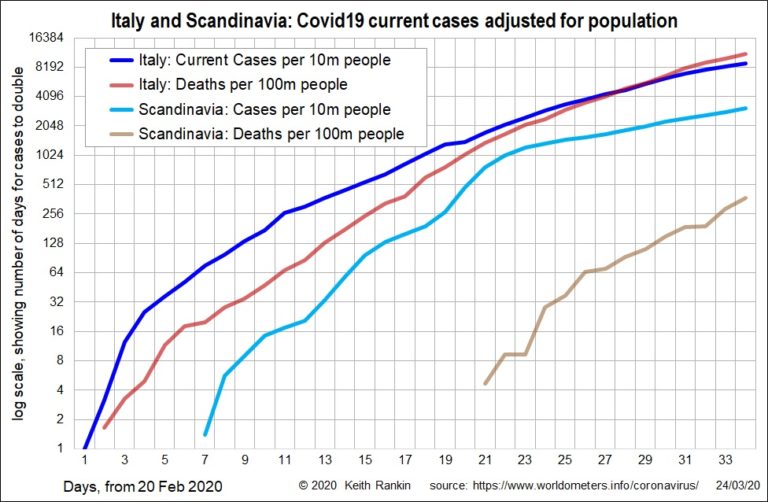
Analysis by Keith Rankin In today’s first chart, of daily new cases in Italy and Scandinavia (Norway, Sweden, Denmark), we see that, at its peak in days 20 and 21 (March 10 and 11), the incidence of known new cases in Scandinavia matched that in Italy. The difference is that new cases stabilised immediately afterwards ... <a title="Keith Rankin Chart Analysis – COVID-19: Exponential Growth in Italy and Scandinavia" class="read-more" href="https://eveningreport.nz/2020/03/25/keith-rankin-chart-analysis-covid-19-exponential-growth-in-italy-and-scandinavia/" aria-label="Read more about Keith Rankin Chart Analysis – COVID-19: Exponential Growth in Italy and Scandinavia">Read more</a>
CoveragePost
March 24, 2020
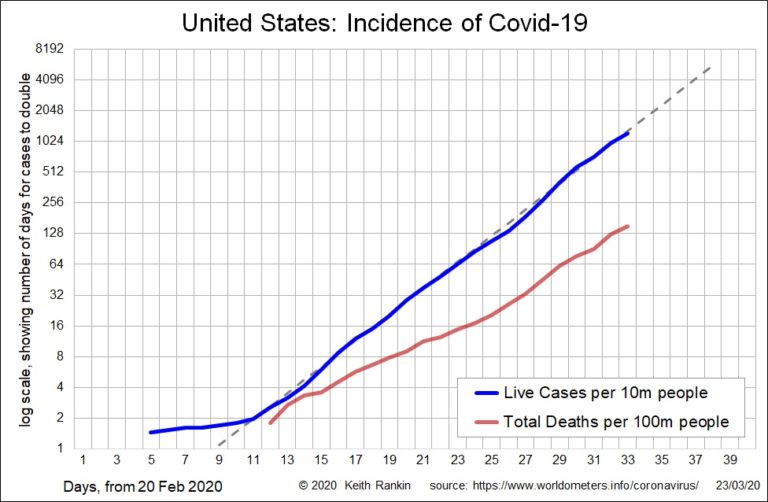
Analysis by Keith Rankin The USA has been on a consisted exponential growth path since day 11 (March 1). Italian Covid‑19 incidence levels – currently just over 8,000 known cases per 10 million people on 23 March – will be reached in the United States by day 39 (Sunday, March 29) if there is no ... <a title="Keith Rankin Chart Analysis – Covid-19 Virus: Exponential Growth in United States and United Kingdom" class="read-more" href="https://eveningreport.nz/2020/03/24/keith-rankin-chart-analysis-covid-19-virus-exponential-growth-in-united-states-and-united-kingdom/" aria-label="Read more about Keith Rankin Chart Analysis – Covid-19 Virus: Exponential Growth in United States and United Kingdom">Read more</a>
CoveragePost
March 23, 2020
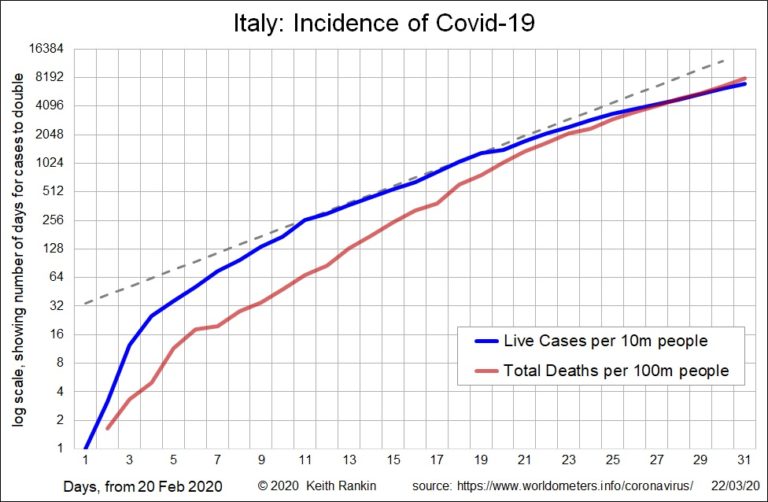
Analysis by Keith Rankin. The two charts here are presented using a ‘logarithmic’ scale. This is the appropriate way of representing any data time series that would normally exhibit exponential growth. ‘Exponential growth’ means that normal growth is measured in percentage terms rather than actual numbers. Common measures that grow exponentially are consumer prices (this ... <a title="Keith Rankin Chart Analysis – Covid-19 Virus: Slowing Exponential Growth in Italy" class="read-more" href="https://eveningreport.nz/2020/03/23/keith-rankin-chart-analysis-covid-19-virus-slowing-exponential-growth-in-italy/" aria-label="Read more about Keith Rankin Chart Analysis – Covid-19 Virus: Slowing Exponential Growth in Italy">Read more</a>
CoveragePost
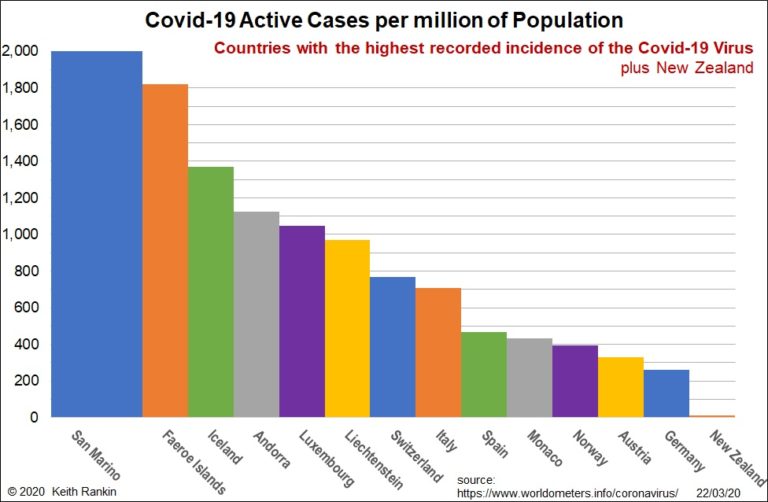
March 22, 2020
Analysis by Keith Rankin. While the number of cases of Covid-19 remains very small relative to the world’s population, a number of prominent people have been caught up in it. It seems to be very much an international travellers’ disease, with people who travel the most being at highest risk. The highest incidences of Covid‑19 ... <a title="Keith Rankin Chart Analysis – Covid-19 Virus: A Jetsetter Disease?" class="read-more" href="https://eveningreport.nz/2020/03/22/keith-rankin-chart-analysis-covid-19-virus-a-jetsetter-disease/" aria-label="Read more about Keith Rankin Chart Analysis – Covid-19 Virus: A Jetsetter Disease?">Read more</a>
CoveragePost
March 17, 2020
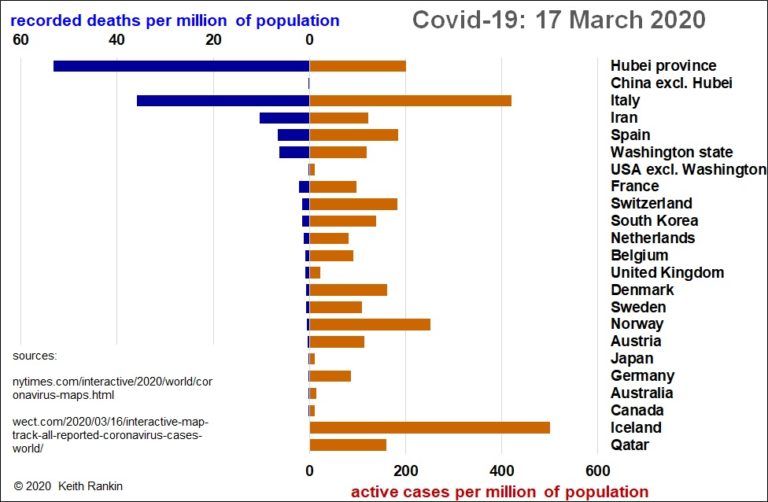
This chart shows the extent that the initial Chinese outbreak of Covid-19 was confined to Hubei province, a province with a population similar to that of Italy. And it shows that, while Hubei still has more recorded deaths per capita than Italy, Italy has more than twice as many active (unrecovered) cases per person. Italy’s ... <a title="Keith Rankin Graph Analysis – Covid-19 Virus: West is Worst" class="read-more" href="https://eveningreport.nz/2020/03/17/keith-rankin-graph-analysis-covid-19-virus-west-is-worst/" aria-label="Read more about Keith Rankin Graph Analysis – Covid-19 Virus: West is Worst">Read more</a>
CoveragePost
March 12, 2020
Analysis by Keith Rankin Will there be a resumption of normality? For a few weeks now, awareness has been growing that the global economic consequences of the Covid19 epidemic (that WHO today notes has “characteristics of a pandemic”) may be greater than the medical consequences, even if the European death rates fail to level‑off, even if ... <a title="Keith Rankin Analysis – Economic Emergency 2020" class="read-more" href="https://eveningreport.nz/2020/03/12/keith-rankin-analysis-economic-emergency-2020/" aria-label="Read more about Keith Rankin Analysis – Economic Emergency 2020">Read more</a>
CoveragePost
March 11, 2020
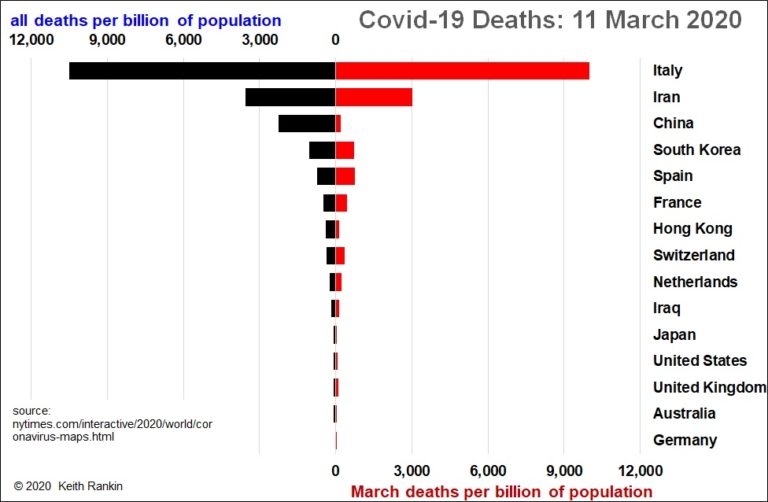
EDITOR’S NOTE: Click here for a previous chart analysis by Keith Rankin on this issue. Chart analysis by Keith Rankin This chart of deaths by coronavirus (March deaths in red) clearly shows just how much worse this epidemic is in Italy than anywhere else. And the vast majority of these deaths are in Northern Italy. ... <a title="Keith Rankin Chart Analysis – UPDATE Covid-19 Virus: Deaths" class="read-more" href="https://eveningreport.nz/2020/03/11/keith-rankin-chart-analysis-update-covid-19-virus-deaths/" aria-label="Read more about Keith Rankin Chart Analysis – UPDATE Covid-19 Virus: Deaths">Read more</a>
CoveragePost
March 9, 2020
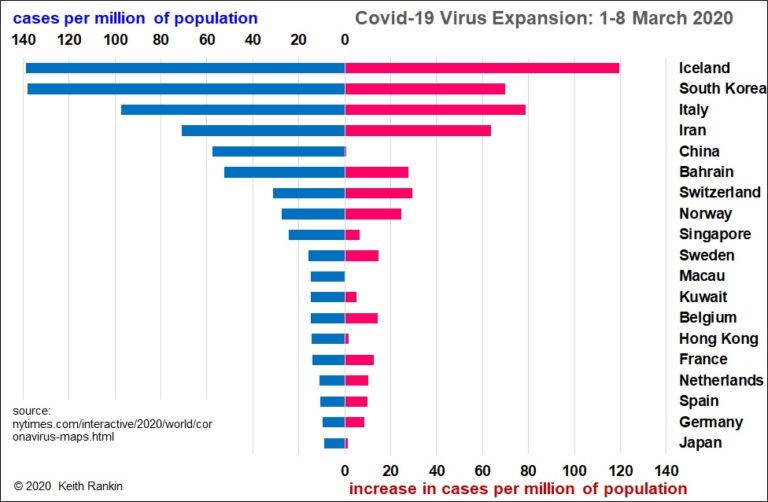
Chart analysis by Keith Rankin EDITOR’S NOTE: Click here for an updated chart and analysis dated March 11, 2020 – This chart update shows different measures of the problem than did my chart posted three days ago. Here we see the total number of recorded cases of Covid-19, per million of the worst affected countries’ ... <a title="Keith Rankin Chart Analysis – Covid-19 Virus: the Reality a week into March 2020" class="read-more" href="https://eveningreport.nz/2020/03/09/keith-rankin-chart-analysis-covid-19-virus-the-reality-a-week-into-march-2020/" aria-label="Read more about Keith Rankin Chart Analysis – Covid-19 Virus: the Reality a week into March 2020">Read more</a>
CoveragePost
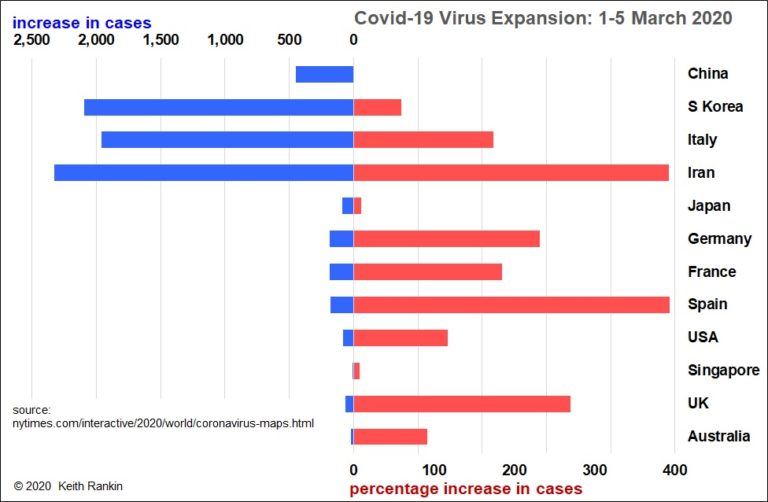
March 5, 2020
Chart analysis by Keith Rankin – The 2020 news cycle has become completely dominated by (probably unintentional, but certainly careless) fearmongering about ‘corona‑virus’. What is the reality in early March? The chart looks at new cases in the 10 countries with the most cases, plus United Kingdom and Australia. We see that the outbreak is essentially ... <a title="Keith Rankin’s Chart Analysis – Covid-19 Virus: the Reality in early March 2020" class="read-more" href="https://eveningreport.nz/2020/03/05/keith-rankins-chart-analysis-covid-19-virus-the-reality-in-early-march-2020/" aria-label="Read more about Keith Rankin’s Chart Analysis – Covid-19 Virus: the Reality in early March 2020">Read more</a>
CoveragePost
December 12, 2019
The case for a complete relocation of Auckland’s Waitematā Harbour freight port is far from established. Nevertheless, Auckland will grow over the long term, and the freight operations need to move away from the area close to the downtown Ferry Terminal. This area should become like Sydney’s Circular Quay. The question is: where is Auckland’s ... <a title="Keith Rankin Op-Ed: Another Option for Auckland’s Port – Tāmaki Ship Canal" class="read-more" href="https://eveningreport.nz/2019/12/12/keith-rankin-op-ed-another-option-for-aucklands-port-tamaki-ship-canal/" aria-label="Read more about Keith Rankin Op-Ed: Another Option for Auckland’s Port – Tāmaki Ship Canal">Read more</a>