Analysis by Keith Rankin.
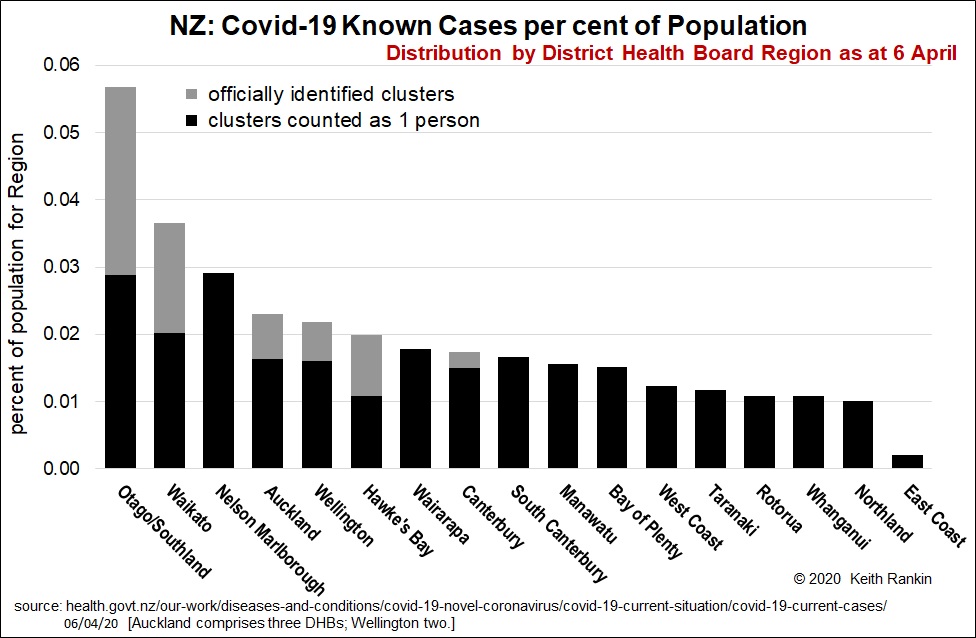
New Zealand now has sufficient case data to get a sense of its regional distribution of Covid19. Surprisingly, Auckland is not dominant, unlike the main business cities in other countries such as London, New York, Milan and Sydney. Certainly, internationally, Covid19 is very much a city disease.
The New Zealand regional chart shows both total cases by region, and cases adjusted for identified clusters. The idea is that clusters could have happened anywhere, and in themselves overstate the community incidences in the regions with clusters.
We see that the regions with the highest incidences of Covid19 are those relatively affluent areas, which are the most Pakeha-dominant. (This is born out by ethnicity estimates, fore which minority ethnic groups are all underrepresented in the present Covid19 data.)
Auckland’s incidence of Covid19 may be surprisingly low in part because of its high ethnic East Asian and Pacific populations.
If we disregard the Ruby Princess cluster in Hawkes Bay, then 8 of the bottom 9 regions are in the North Island; the exception is the West Coast.
When New Zealand moves from Level 4 shutdown to Level 3 or Level 3.5, it looks as though all regions should be treated equally. Even Otago/Southland – the worst affected – is not dramatically worse than the other regions.
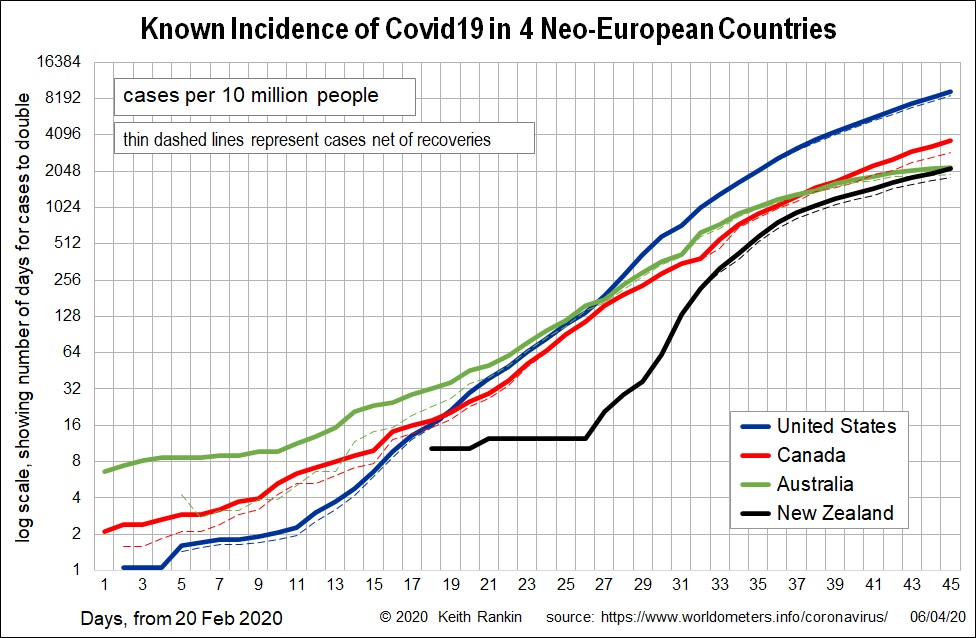
The second chart is an update of the one that compares New Zealand with Australia, Canada, and United States. We can see that New Zealand and Australian case data have converged, and it is likely to stay that way. Both these countries have very low percentages of positive test results; a ratio of cases to tests of less than 0.02; it is much worse in the USA where the ratio is 0.19. Canada has a case ratio of 0.05. New Zealand has tested 0.8 percent of the population, similar to Canada but less than Australia. The USA, which has tested less than 0.6 percent, clearly has a much higher unknown incidence of Covid19 than Canada, which in turn has a substantially higher unknown incidence than New Zealand and Australia.
It is looking increasingly like New Zealand and Australia will approach the winter in good health.