Analysis by Keith Rankin.
Yesterday the provisional Quarterly Economic Growth data was released. It showed that, seasonally adjusted, remunerated output (ie GDP, gross domestic product) fell 0.9% in April-to-June compared to January-to-March. While the resulting media hoo-ha overstated the significance of this result, there was still very little coverage of the underlying problem; New Zealand appears to be at the peak (not the trough) of a structural recession.
I have represented the same latest New Zealand growth data in three charts: biannual (rather than quarterly) economic growth; annual growth, and biennial growth.
Biannual Growth
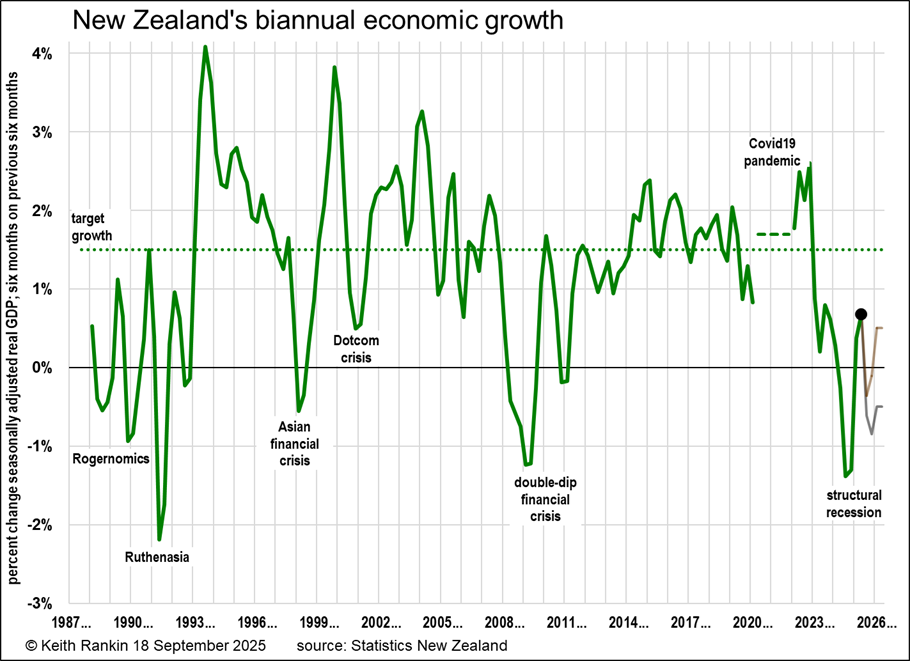
In the chart above (and the other two charts, below), the black dot represents the latest datapoint. To the right of the black dots are ‘slightly optimistic’ and ‘slightly pessimistic’ forecasts projected to early 2026.
The first thing to note is that the latest biannual growth datapoint is 0.7%, which translates to annualised growth of 1.4%. The policy target for annualised growth is three percent (equivalent to 1.5% for biannual data, and 0.75% for quarterly data). The 0.7% statistic is the seasonalised GDP for the first half of this year compared to the second half of last year.
In the present scheme of things 0.7% biannual growth is rather good. The most important feature of the data series is the surprisingly high figure for the first quarter of 2025; a bounce-back from the 2024 disaster. The second quarter ‘slump’ does no more than reverse the first quarter rise, suggesting a ‘flat economy’.
The chart shows the data series as released by Statistics New Zealand; that quarterly GDP series begins in the second quarter of 1987, when ‘Rogernomics’ was in full swing. The first available biannual growth datapoint is for the beginning of 1988. We also note that I have omitted the wildly swinging short-term growth data for the two years of the Covid19 lockdowns. The dashed line for 2020 and 2021 indicates average growth for those years.
The chart shows the economic crises of the last 40 years. In doing so it shows that there is a common pattern of above-average growth immediately after a crisis; this is the easy re-employment growth that follows a period of high unemployment. This did not happen so much in the period of the early-2010s, when the New Zealand government pursued a policy – moderate by European Union and United Kingdom standards – of ‘fiscal consolidation’.
We also note that the high bounce-back in 1993, when Ruth Richardson’s ‘dead hand’ was being eased off the tiller, was not enough to prevent – in the election that year – ‘the Right’ suffering its biggest electoral deficit since 1938.
The most recent part of the biannual chart suggests that New Zealand is currently at (or just past) the peak of a structural recession. Biannual growth will be negative for the period April-to-September, even if quarterly growth is positive. We note that the early 2025 growth ‘spurt’, linked to New Zealand’s near-record-high terms of trade (the record was in 2022), is still well below the biannual growth target of 1.5%.
Annual Growth
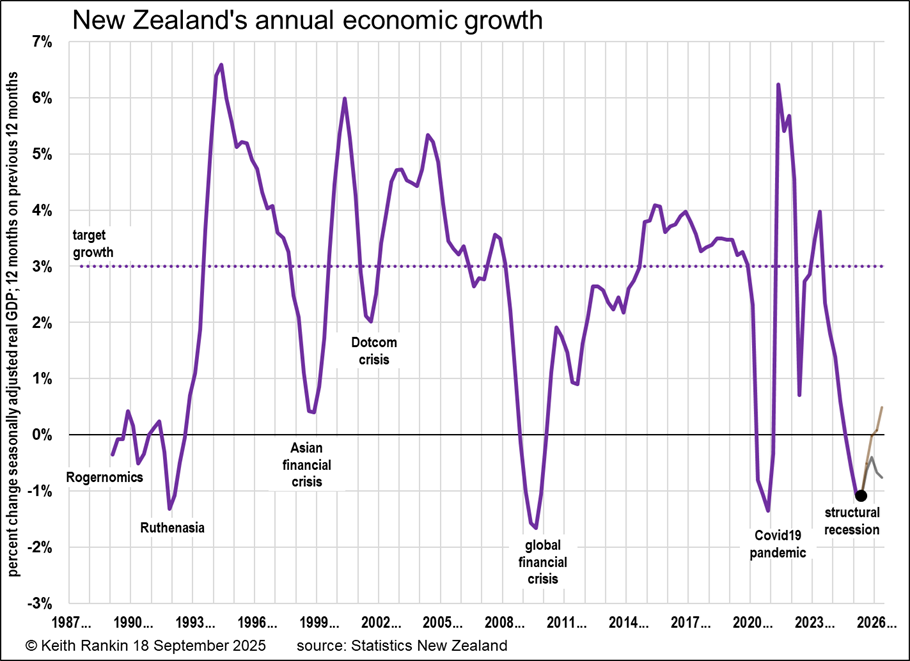
The second chart shows the same data, but comparing a whole year with the previous whole year. Here much of the nasty 2024 recession is incorporated into the most recent datapoint. The whole experience looks much like the global financial crisis which troughed in 2009; though this time New Zealand has performed relatively worse compared to other developed nations.
The long structural recession of Rogernomics and Ruthenasia (Roger Douglas and Ruth Richardson) remains a standout, however. Those years of the late 1980s and early 1990s represent fiscal and monetary austerity at its silliest.
Biennial Growth
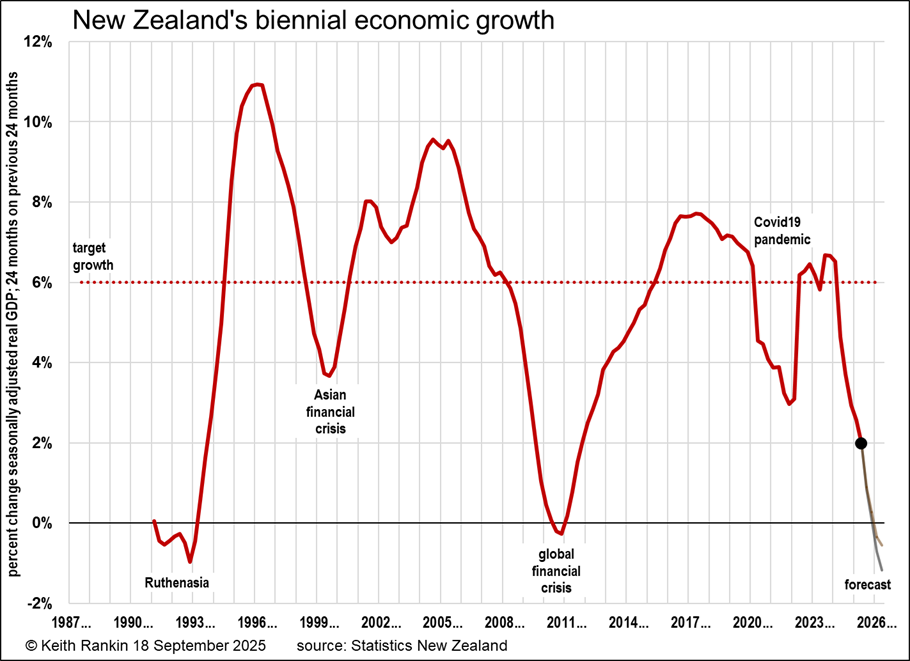
For some purposes, even annual growth is too ‘short-term’. For fifty-year-plus analysis, I sometimes favour quinquennial growth calculations. But biennial growth gives a good big picture when looking back three to five decades.
Here we can see the substantiality of the Ruthenasia policy crisis and of the global financial crisis; and how a relatively normal crisis such as that of the late 1990s should be placed in context.
Looking at today, even my slightly optimistic projection (of one-half percent biannual growth) shows a structural recession comparable to the global financial crisis. We note that interest rates in most developed countries were reduced to near-zero as a rapid policy response to the 2008/09 global crisis. (Global inflation didn’t happen in the 2010s, as the woe-betiders claimed it would!) We see none of that urgency this time, noting that something like the present New Zealand malaise is emerging in United Kingdom, France, Canada, and especially Germany. Others are likely to follow these.
Reflection
New Zealand’s economy is stuck in a mire. With other major economies following suit, it’s much more likely that things will get worse not better, as the decade progresses. As the first chart shows, the New Zealand economy has recently ‘enjoyed’ a peak – albeit a low peak – not a trough.
Lower interest rates will not solve the problem. That’s like ‘pushing on a string’ as the textbooks used-to-say. Governments need to generate revenue by spending more, not less; more spending means more income means more income tax, and means more investment in the economy rather than in the casino.
*******
Keith Rankin (keith at rankin dot nz), trained as an economic historian, is a retired lecturer in Economics and Statistics. He lives in Auckland, New Zealand.