Analysis by Keith Rankin.
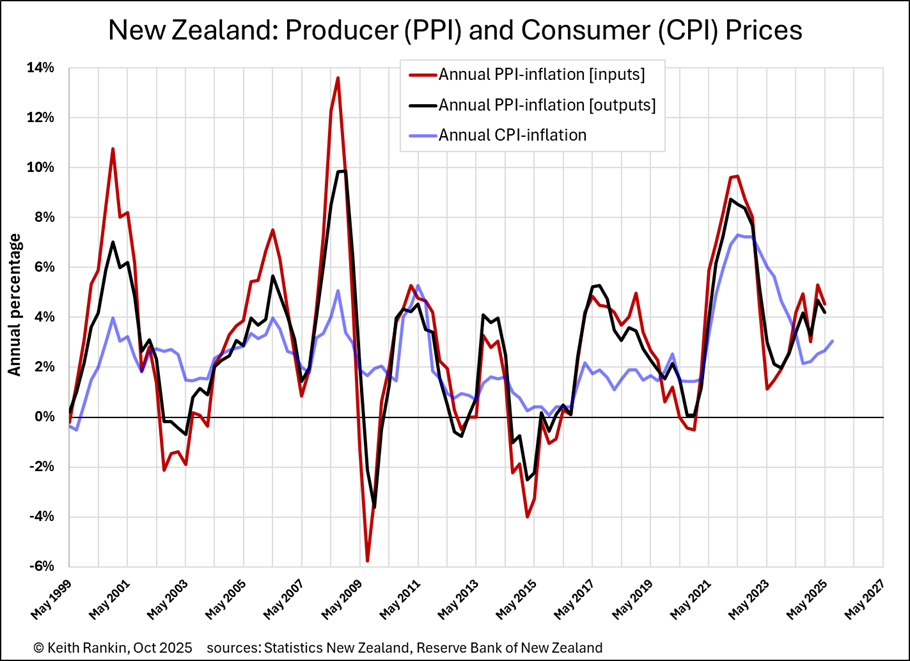
The first chart shows annual price increases in New Zealand for businesses (PPI: Producers Price Index) and consumers (CPI: Consumers Price Index), since 1999. We note that the latest CPI datapoint is for the third quarter of 2025, meaning that it’s centred on mid-August. The most recent PPI data is for the second quarter of 2025, meaning that it’s centred on mid-May.
For the whole period, the first important points to note are that the PPI is more sensitive to changing influences on prices than the CPI, and that the PPI tends to lead the CPI. Indeed, annual CPI inflation is a lagging measure of price change; meaning that it’s a poor measure to base policy decisions on.
The other key point to note is the unusually long lag of the CPI after 2022. Using the more sensitive and timely PPI measure of price inflation, we see that inflation in New Zealand troughed in 2023, and that, using the ‘outputs’ PPI, annual inflation in New Zealand was bang-on the two percent policy target at the time of the 2023 general election.
Despite the claims of our Prime Minister that he inherited “seven percent inflation” from the previous Labour government, in the two years since the election, actual inflation (based on the more sensitive PPI) has been rising.
It is very clear that there was a double ‘price spike’ in 2021 and 2022, periods exactly corresponding to the disruptions to global supply chains caused first by the Covid19 pandemic and secondly by the Russia-Ukraine war. Commodity price increases (PPI-inputs) fell almost to one-percent once those global supply disruptions were resolved. After that, the main source of ‘cost-of-living’ increases – suggested by the CPI lag in 2024 – was panicked and counterproductive domestic policy measures.
Historically, we note that, at the onset of the 2008 Global Financial Crisis, inflation in New Zealand was far worse than anyone realised at the time. We also note that, while the 2011 ‘spike’ in CPI-inflation was due mainly to the increase in the GST rate, there was also a spike in producer price inflation at that time. Normally the amplitude of PPI-inflation is greater than for CPI-inflation; because of GST, this amplitude difference did not happen.
Best leading measure of price variation: biannual price change
The most-timely measure of price variation is the quarterly change of the PPI [inputs]. However, quarterly measures are notoriously ‘noisy’, so the first reliable measure of price variation is the six-monthly [ie biannual] change in prices. The measure here takes six months (the two most recent quarters, averaged) compared to the previous six months.
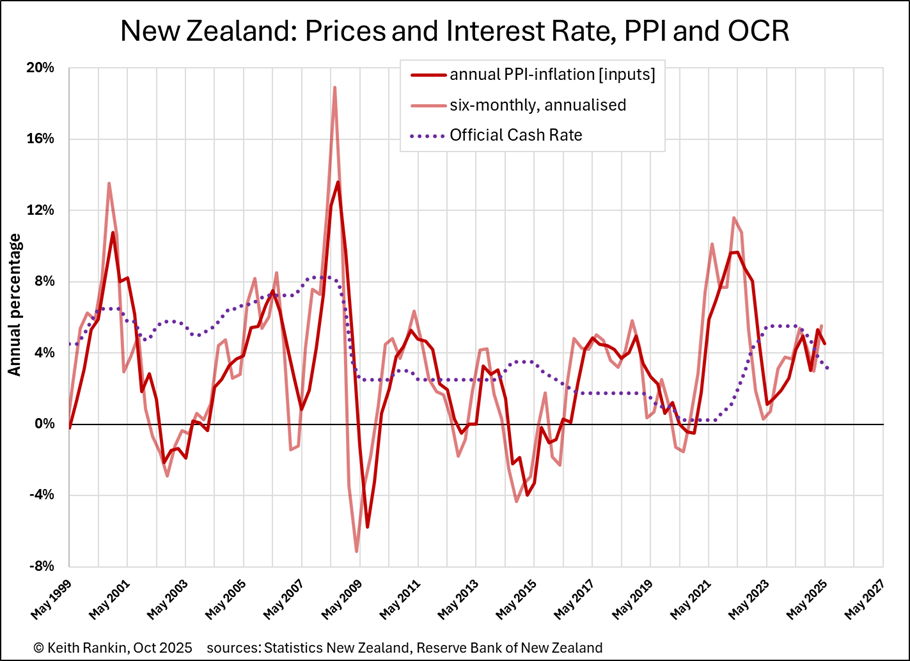
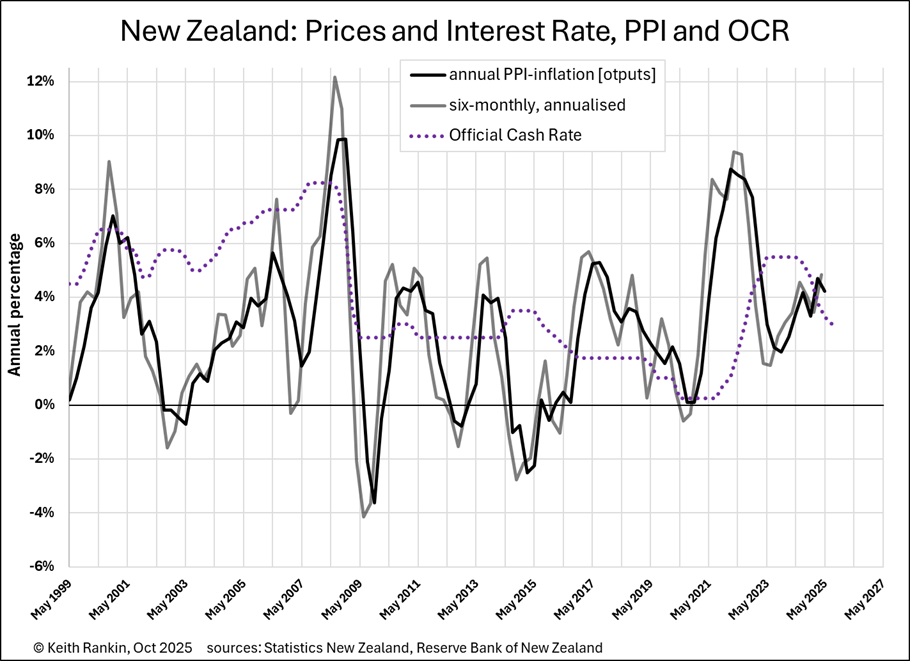
The second and third charts clearly show both the annual and annualised biannual rates of PPI-inflation. The chart clearly shows how the six-monthly (biannual) inflation rate reveals the key inflation turning points first. By the August 2023 release of the PPI data, it was evident that – by the first available measure of prices – inflation in the first half of 2023 was below two percent. Yet, in election year, the Labour Government never mentioned this very favourable piece of economic news! Why was the actual data not being discussed? Presumably because the truth conflicted with the narrative about inflation; the narrative which New Zealand society succumbed to and was cowered by. Part of the problem is the time-poor (and sometimes credulous) media having been, in effect, trained to follow certain statistical indicators but not others.
These charts also plot the Official Cash Rate (OCR), the principal (though typically misplaced) policy lever to push-back on inflation and deflation. They show that anti-inflation policy commenced late in 2021, and peaked in 2023 and 2024. Thus, the ‘anti-inflation’ policy was persevered with well-after the leading indicators had shown that the inflation problem had disappeared.
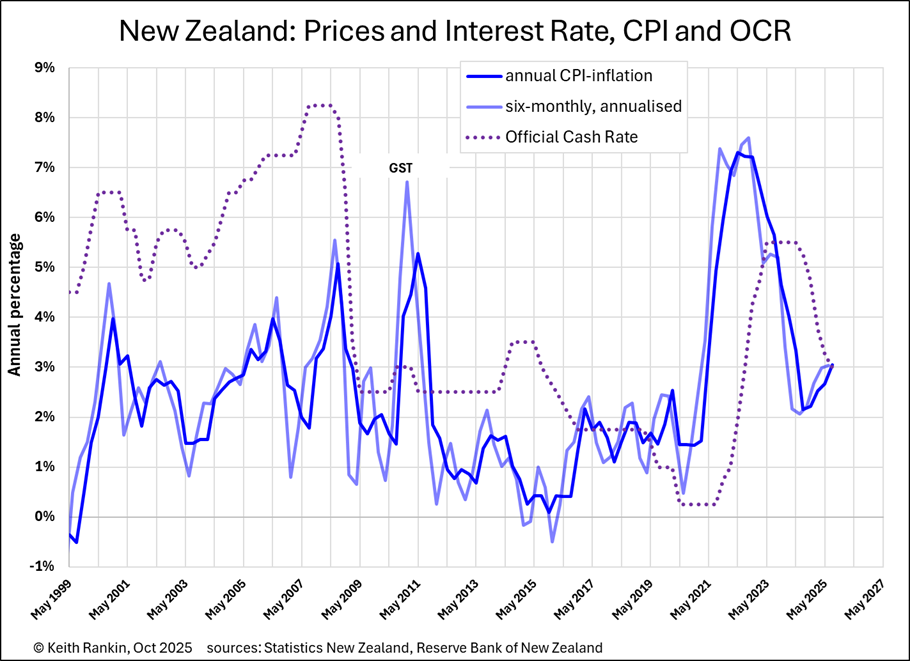
The fourth chart shows the annual and annualised biannual rates of increase of consumer prices, again showing the OCR as well. Once again, even though the CPI is a lagging price-level indicator, a proper look at the CPI data shows that CPI-inflation was falling markedly in 2023, and that there was no case for anti-inflation policy in late 2023.
The explanation for the unusually long lag of the CPI (compared to the PPI) lies in the fact that the perseverance of anti-inflation policy itself created an ongoing ‘cost-of-living crisis’. If we go back to the first chart shown, it is the long lag in CPI inflation in late 2023 and in 2024 that is in fact the essence of the ‘cost-of-living crisis’. Rather than the crisis being cured by the contractionary monetary policy settings (of the OCR), that extended CPI lag was caused by the anti-inflation policy.
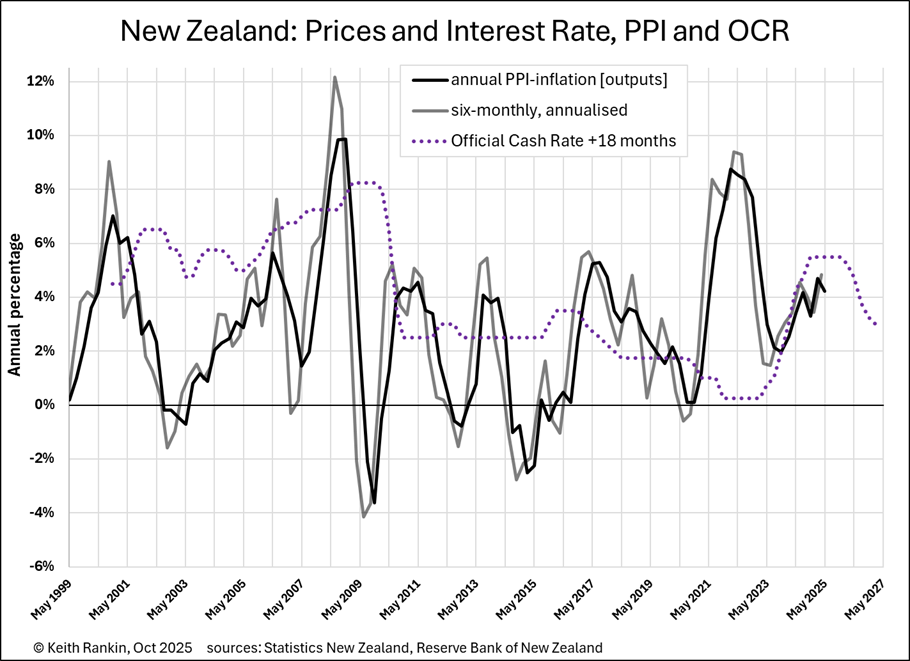
The fifth chart goes back to the PPI-inflation, using the ‘outputs’ measure of business prices, as in the third chart. This chart shows the OCR settings shifted by 18-months, to simulate an 18-month lag. The reason for this is that we are told that monetary policy takes at least a year – with Reserve Bank research in the late 1980s claiming as much as five years – before monetary policy ‘does its work’. If 18 months is the correct lag between policy and outcome, then we should see upturns in the OCR coinciding with downturns in inflation; and downturns in the OCR coinciding with upturns in inflation.
Instead, considering the two years from mid-2023, we see the very opposite, the upturn of the OCR almost exactly coinciding with the upturn of business inflation. We know that the short inflation spike of 2021 and 2022 was caused by global supply-chain disruptions; this kind of causation is probably true of some other inflation spikes. Also exchange rate fluctuations contribute to spikes in price variation. If we look at the late 2010s, we see falling interest rates accompanying falling rates of price increase; contra to the policy narrative. In the early 2010s we see fluctuating inflation while interest rates were essentially unchanging. In the late 2000s, we see interest rate increases matching inflation increases; again, contra to the policymakers’ narrative.
The conventional neoliberal narrative about inflation is that there is a substantial lag in policy effectiveness, and that inflation is principally driven by expectations of inflation. In this narrative, the inflation data should not be ‘spiky’ at all; rather, once set in, inflation supposedly establishes its own momentum or inertia. The PPI data clearly refutes this ‘momentum’ narrative; inflation is not driven by expectations arising from immediate past inflation. And the alleged momentum in CPI-inflation in New Zealand in 2024 is clearly false; rather there was a lag in CPI-disinflation caused by interest rates being too high; not too low. (Disinflation is falling inflation, whereas deflation is falling prices.)
Accepted reasons for an OCR-increase to PPI-outcome lag include the fact that business loans – like home loans – are typically set at fixed interest rates, for say two or three years. In the case of a falling OCR, however, businesses may quickly repay (or break) high interest loans and refinance as quickly as possible with the new low interest rates. So, policy reductions in the OCR are likely to affect outcomes more quickly than increases in the OCR.
It is looking as if anti-inflation policy actually achieves a mix of neutral and pro-inflationary outcomes. My suspicion is that anti-inflation policy is substantially pro-inflationary – counterproductive – with a lag of 15-24 months; and anti-deflation policy is actually pro-deflationary, with a shorter lag.
It is likely that the lag from anti-deflation policy (as in these years: 2001, 2008, 2015, 2019; refer third chart) to consequential deflation is quite short, in large part because the commencement of disinflation commonly precedes the policy. (Like trying to end a war that’s already ending.)
2026 and 2027 will be interesting because the longer outcome lag from high interest rates in 2024 and the shorter outcome lag from falling interest rates in 2025 suggests a wait until later in 2026 before there are marked falls in PPI-inflation, and early 2027 before marked falls in CPI-inflation.
There are at least two disruptors, however, given the global environment in flux. First is the 2025 American-led haphazard disruption to the already disrupted global economy, including the redirection of global supply-chains in favour of military goods and services. Second, for New Zealand, there is the ever-present possibility of a domestic financial crisis which would see a rapid fall in the value of the New Zealand dollar and therefore a 2027 spike in high rather than low inflation.
*******
Keith Rankin (keith at rankin dot nz), trained as an economic historian, is a retired lecturer in Economics and Statistics. He lives in Auckland, New Zealand.


