Analysis by Keith Rankin. Interest Rates and Increasing Prices: The Facts


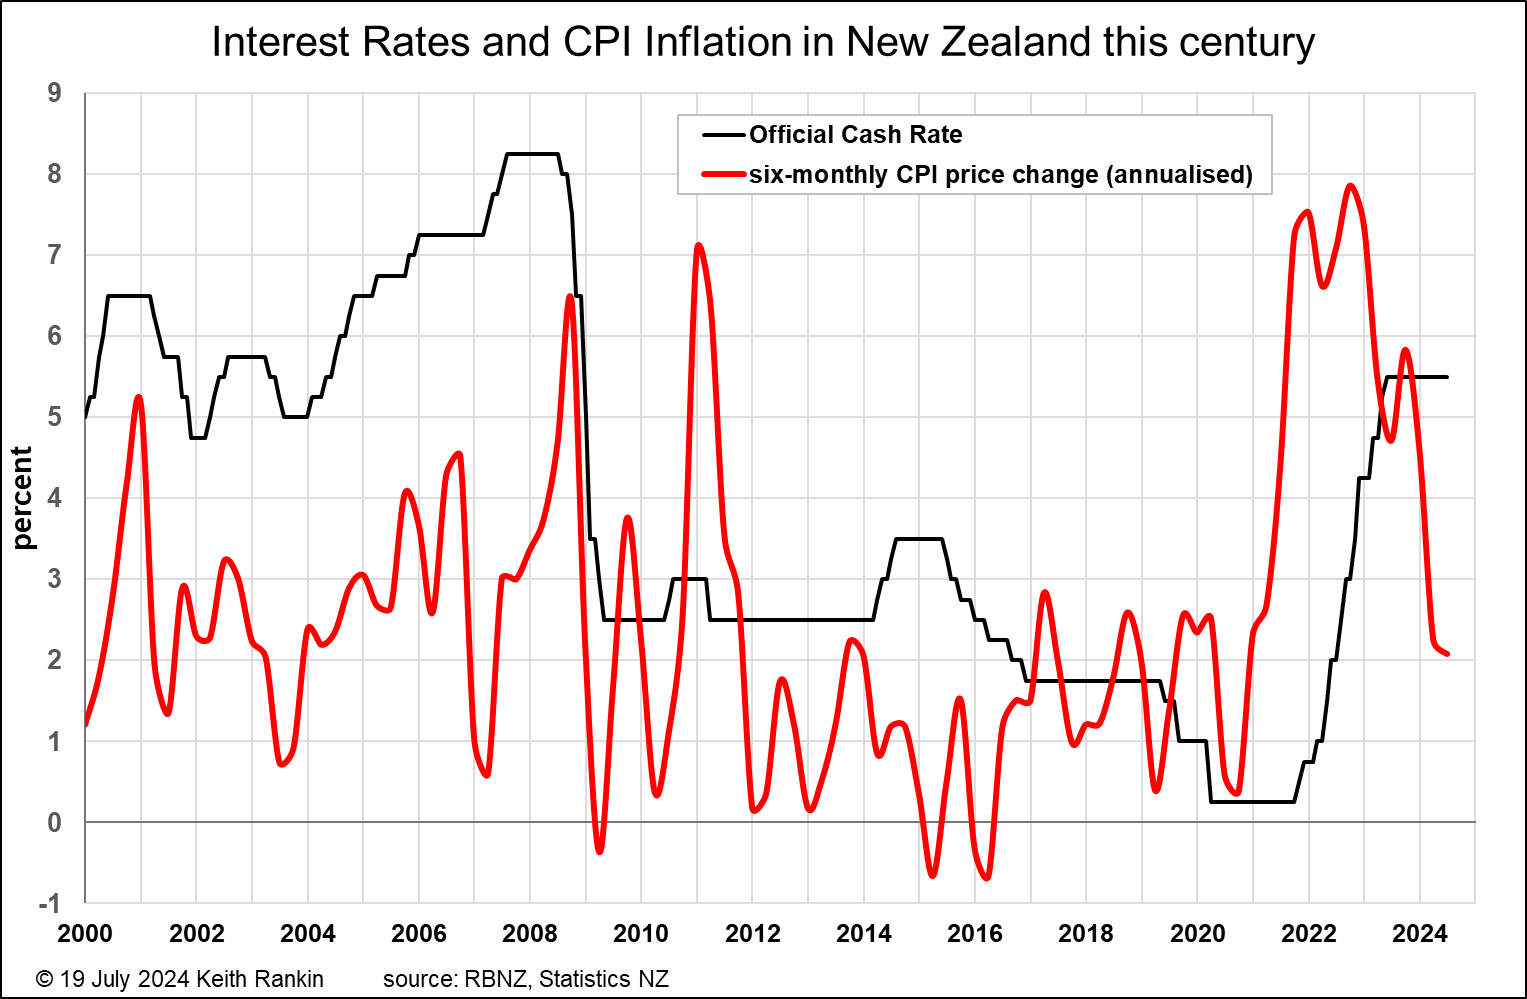
The first chart above challenges the received view that inflation in New Zealand remains stubbornly high, and that it is therefore appropriate for the Reserve Bank’s official cash rate (OCR) to be held for at least a few more months at its damagingly high level of 5.5%.
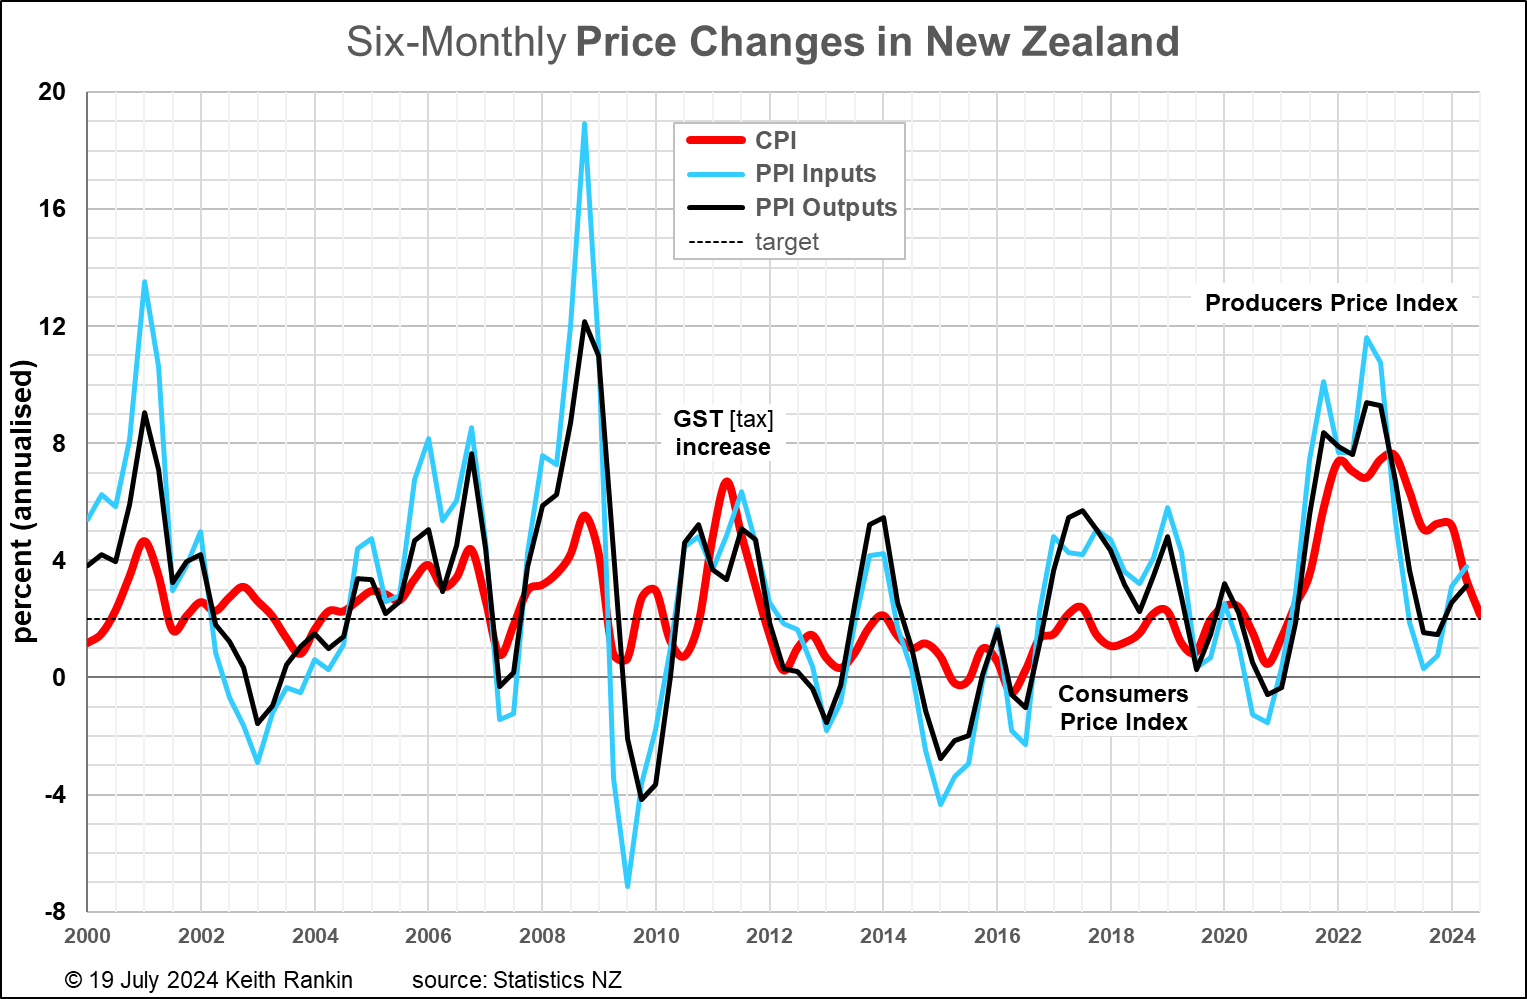
The second chart suggests that inflation in New Zealand was already dead in 2023, and that – inasmuch as there was ever an argument for high interest rate monetary policies – those high interest rates should have come down sharply during 2023.
The first chart uses a measure of CPI inflation appropriate to the problem at hand. When the CPI data was released on 17 July, the only figure really mentioned was the 3.3% headline annual figure. This was calculated by comparing prices in April-June 2024 with prices in April-June 2023. The problem is that most of that 3.3% occurred in 2023, not 2024. The first chart above uses a CPI inflation measure that compares April-June 2024 to October-December 2023. (Then it annualises – ie scales up that measure – to make it fit the convention that both interest and inflation rates should be quoted in the form of annual rates.)
The actual increase in prices during 2024 so far is 1.0%, which annualises to 2.1%. The monetary policy target band for CPI inflation is between one percent and three percent, with a midpoint of two percent. The CPI inflation data now sits right in the centre-point of that target range. The CPI inflation rate is now precisely on target, so there should be no anti-inflation policy in place.
Further, in the first three months of 2024 – as the first chart shows – the CPI inflation rate was 2.25%. This means that the Reserve Bank, focussing on CPI inflation, should have reduced the OCR in April. Yet it still has not done so, despite this month reviewing its interest rate.
The first chart shows a number of other things, as well. The bout of so-called inflation starting early in 2021 was in fact a cost-escalation arising from the pandemic disruption to global supply chains. By early 2022 those cost increases had been largely factored in by the world markets; there was no epidemic of inflation expectations, which was the pretext for the policy ratcheting-up of interest rates. Unfortunately, in 2022 there was another supply-cost shock, in the form of the Russia-Ukraine war. Again, no epidemic of inflationary expectations; just a second ‘spike’ in the CPI chart.
Looking at the whole of the twenty-first century, we see that CPI-inflation has been mainly a set of ‘spikes’, and not processes that ever needed the economic equivalent of chemotherapy. (The spike early in 2011 was the increase in the GST rate from 12.5% to 15%.) Further, and despite the alleged concerns of the monetary hawks during the 2010s, the historically low interest rates of that decade did not ignite an inflationary process.
The first chart reveals just one inflationary process, from 2004 to 2008 (albeit with a dip early in 2007, due to a sharp appreciation of the New Zealand dollar); a process that seems to have been exacerbated by rather than relieved by the then policy of raising interest rates.
The first chart also shows something that is very important to note. It shows a perceived norm, from 2000 to 2008, of interest rates being persistently three percentage points above the CPI inflation rate. Much needs to be said about that false normality, but not here. What should be noted here though is that this 2000-2008 pattern of substantial ‘real interest rates’ – a pattern also prevalent in other western capitalist countries – was the real cause of the 2008/09 Global Financial Crisis. The strong suggestion is that monetary-policy hawks favour high interest rates for reasons other than inflation suppression.
(We should also note that the 2000 to 2008 situation occurred under the watch of a ‘progressive’ Labour government. The Left, at least since 1984, has been particularly weak in critiquing interest rate policies most associated with Margaret Thatcher and her virulent battle against the working class in 1980s’ United Kingdom.)
The second chart uses two other measures of inflation – arguably better measures than the CPI – and also a slightly different version of the CPI measure used in the first chart.
The other two measures may be called ‘PPI inflation’, where PPI means ‘producers price index’. Probably the PPI Outputs index is the best measure of prices that we have; the inputs’ measure is probably too sensitive to movements in the New Zealand dollar exchange rate.
We note that the PPI Outputs’ measure shows clearly that the pandemic effects and the Ukraine war effects were nothing more than ‘cost spikes’; and were not at all indicative of inflation processes. We also note that the PPI inflation measures show that the 2004 to 2008 period was a more dramatic inflationary process than the CPI reveals. And we note that the period 2017 to 2019 was one of a degree of PPI inflation that didn’t feed into the CPI. From the first chart, it looks like the main reason that the CPI did not rise in those three years was because interest rates were cut to then record lows. The way to suppress inflation then was to reduce interest rates, not to raise them.
Technical Note
When \there is a new quarterly CPI or PPI release, there are five annualised measures of inflation that can be calculated.
One. The most up-to-date measure is to just take the increase over the previous three months, and then to annualise it (ie scale it up). For the CPI, in this measure, the result for the June 2024 quarter is 1.6% and for the March 2024 quarter it is 2.6%. The PPI outputs measure for March 2024, on this basis, is 3.5%; indeed the PPI shows that prices have bottomed out, and are now on the rise.
Two. The measure I used in the first table gives an annualised CPI inflation rate of 2.1% for June 2024 and 2.25% for March 2024. The PPI Outputs measure, on this calculation, is 3.2%.
Three. There is another six-monthly measure, which is the one used in the second chart. It’s a bit less sensitive to the most recent datapoint, but also less likely to be distorted by any ‘noisy’ or ‘rogue’ elements in any particular datapoint. This measure averages the two most recent datapoints (in this case the two 2024 data items) and compares with an average of the previous two datapoints. It yields CPI inflation measures of 2.16% (June) and 3.41% (March). This PPI Outputs measure for March 2024 is 3.14%. (Economic historians prefer less noisy measures, whereas financial markets and journalists should be focussing on the latest news.)
These measures, based on quarterly or six-monthly change, may be subject to ‘seasonal noise’. But generally the CPI is much less subject to substantial seasonal influences than is production, trade or employment data.
Four. There are also two annual measures. One, the noisier one, is the measure most commonly quoted in the media, and appears to be the measure most used by policymakers. It takes the most recent three-monthly datapoint (ie April to June 2024) and compares it with the data for the same three months of the previous year. This is ‘noisy’ because it is over-influenced by ‘one-off’ events in that part of either last year or this year. It is not subject to any averaging out.
For this ‘official measure’, the most recent CPI inflation rate is 3.3% and the March CPI rate was 4.0%. The PPI outputs rate for the March quarter was 2.6%, within the monetary policy target range of between 1% and 3%. Inflation was nothing like the problem in 2023 that it was presented as being; though the cost of living was (and still is) a problem, because the major cost problem that affects many people – directly or indirectly – is high interest rates (which are excluded from CPI or PPI inflation measures).
Five. The final measure of CPI or PPI inflation is the least noisy, and best for economic historians. Its disadvantage is that it’s the least current measure. It is the method that’s applied to production data to calculate the economic growth rate. This method averages the four most recent quarters of data, and compares that average with the average for the previous four quarters.
Under this historical final measure, the most recent CPI inflation rate is 4.4% and the previous rate was 5.1%. The most recent (March 2024) PPI Outputs inflation rate is 2.4%. This last figure is highly significant. It will tell discerning future historians that the supposed inflation problem of 2022 was already over early in 2023.
*******
Keith Rankin (keith at rankin dot nz), trained as an economic historian, is a retired lecturer in Economics and Statistics. He lives in Auckland, New Zealand.


