Analysis by Keith Rankin.

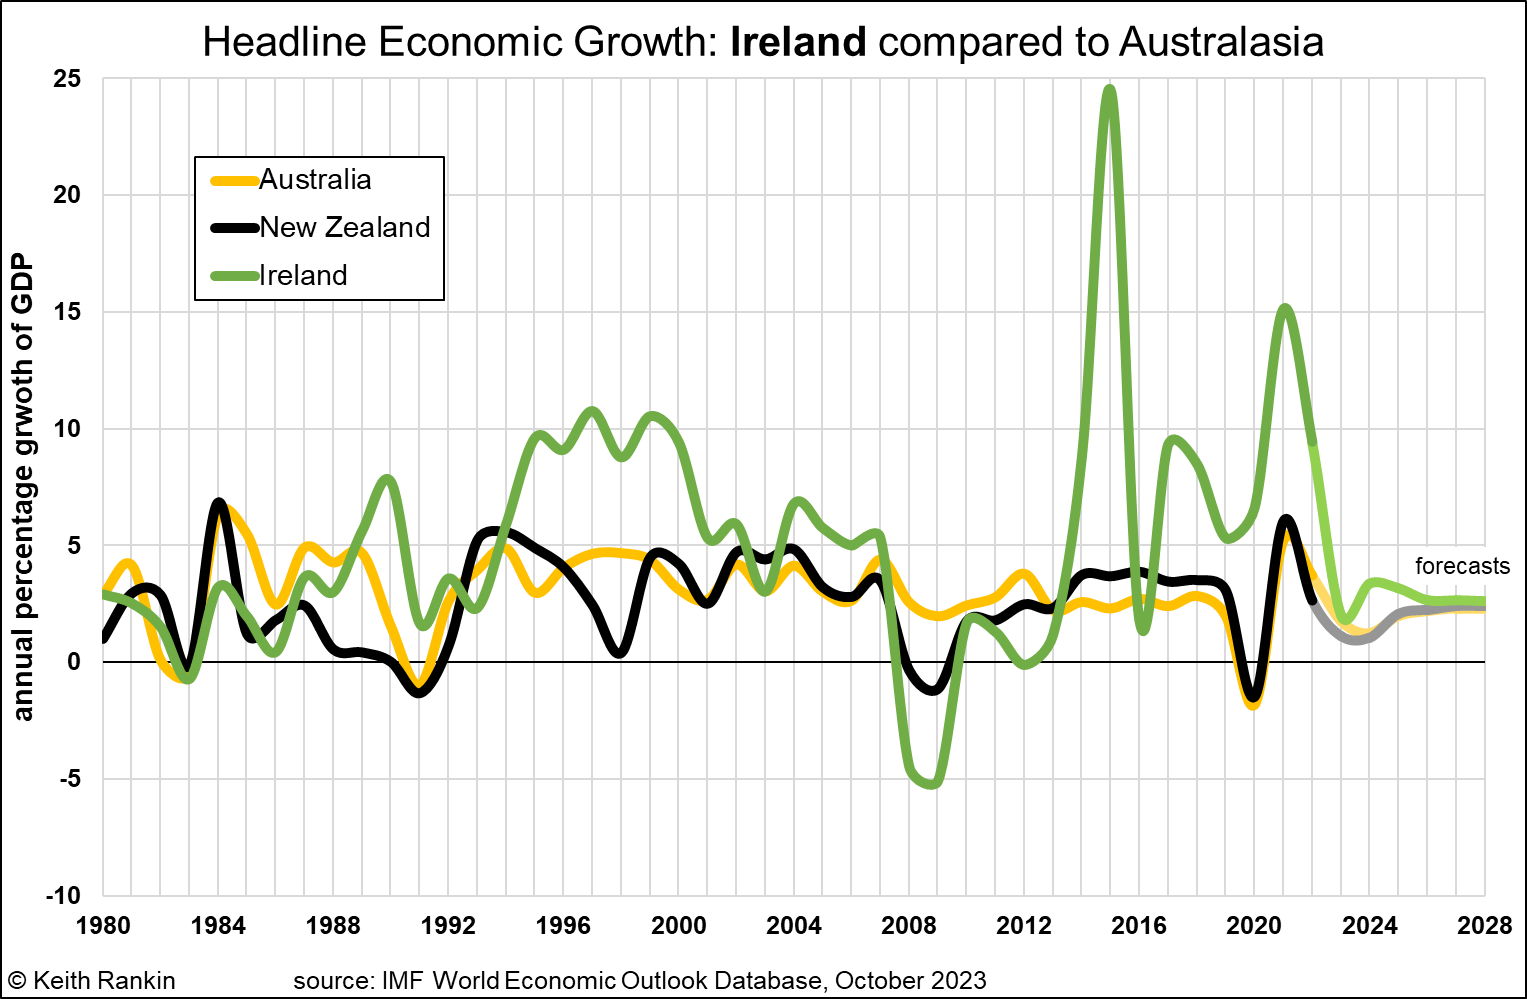
This chart shows the anomalous economy which is Ireland. In tradingeconomics.com, Ireland and New Zealand are shown as having exactly the same population (5.15m). Yet Ireland has a GDP of $US529 billion, whereas New Zealand has a GDP of $US247 billion, less than half. (Even Sweden, with double Ireland’s population, has a GDP only 11% higher than Ireland.) GDP is a measure of the market output/income of a nation state, with all paid services being included.
As I noted two weeks ago, the reason for the big difference in living standards today between Australia and New Zealand lies in the greater economic growth in Australia in the late 1980s. Yet, in today’s chart the difference between New Zealand and Ireland is vastly greater than the difference between New Zealand and Australia. Yet nobody has noticed. Ireland does not brag about this.
(Indeed I am currently watching the TV drama Redemption, set in Dublin featuring a Liverpool detective and her deceased daughter. In the programme, the underclass in Dublin looks much like the underclass in allegedly poorer Liverpool, and in poorer Aotearoa New Zealand.)
This indicates one particular problem with GDP data which is not usually highlighted by GDP critics. Within the European Union, too much income of the EU is attributed to Ireland. It’s because of Ireland’s ‘race to the bottom’ company tax rates, and about Ireland’s strategic geography as an English language gateway to Europe.
Strictly, GDP is meant to be a measure of production (gross domestic product); in an ancillary sense, GDP is also taken to be a measure of income earned in a sovereign territory. But in large parts of the service sector, it is almost impossible to measure output; so ‘income’ is taken as a proxy measure of output, of production. In other words, the many ‘servants’ who produce very little but get paid very much are taken to produce as much as their salary indicates. Thus, a consultant receiving €100,000 per year is assumed to produce twice as much as a school-teacher earning €50,000.
(Conundrum. One team of servants produces €1,000,000 worth of policy plans, and another team provides a €1,000,000 analysis that leads to the abandonment of those plans. Is the total output €2,000,000. Or is it zero? Certainly, the national accounts will say that it’s €2,000,000.)
Ireland has an underlying economy similar to New Zealand, but a top-twenty percent of the population earning significantly more than New Zealand’s affluent top twenty percent.
It will be, though, that much of the income (and hence output) attributed to the Irish economy is in fact the income of Irish non-residents. Meaning that the Irish GDP is to some extent a statistical artefact; as was the super growth of the ‘celtic-tiger’ era (1990, late-1990s and mid-2000s), the post GFC era (2015 and 2017), and the Covid-era (2021).
One point of interest, this week, will be just how much of Ireland’s financial windfall will have been invested in Irish rugby. Rugby is an elite sport in Ireland, as it is in England and Australia. Will money talk? As I understand it the bookmakers say, ‘yes’, that Ireland will defeat the New Zealand All Blacks!
______________
Keith Rankin (keith at rankin dot nz), trained as an economic historian, is a retired lecturer in Economics and Statistics. He lives in Auckland, New Zealand.


