Analysis by Keith Rankin.


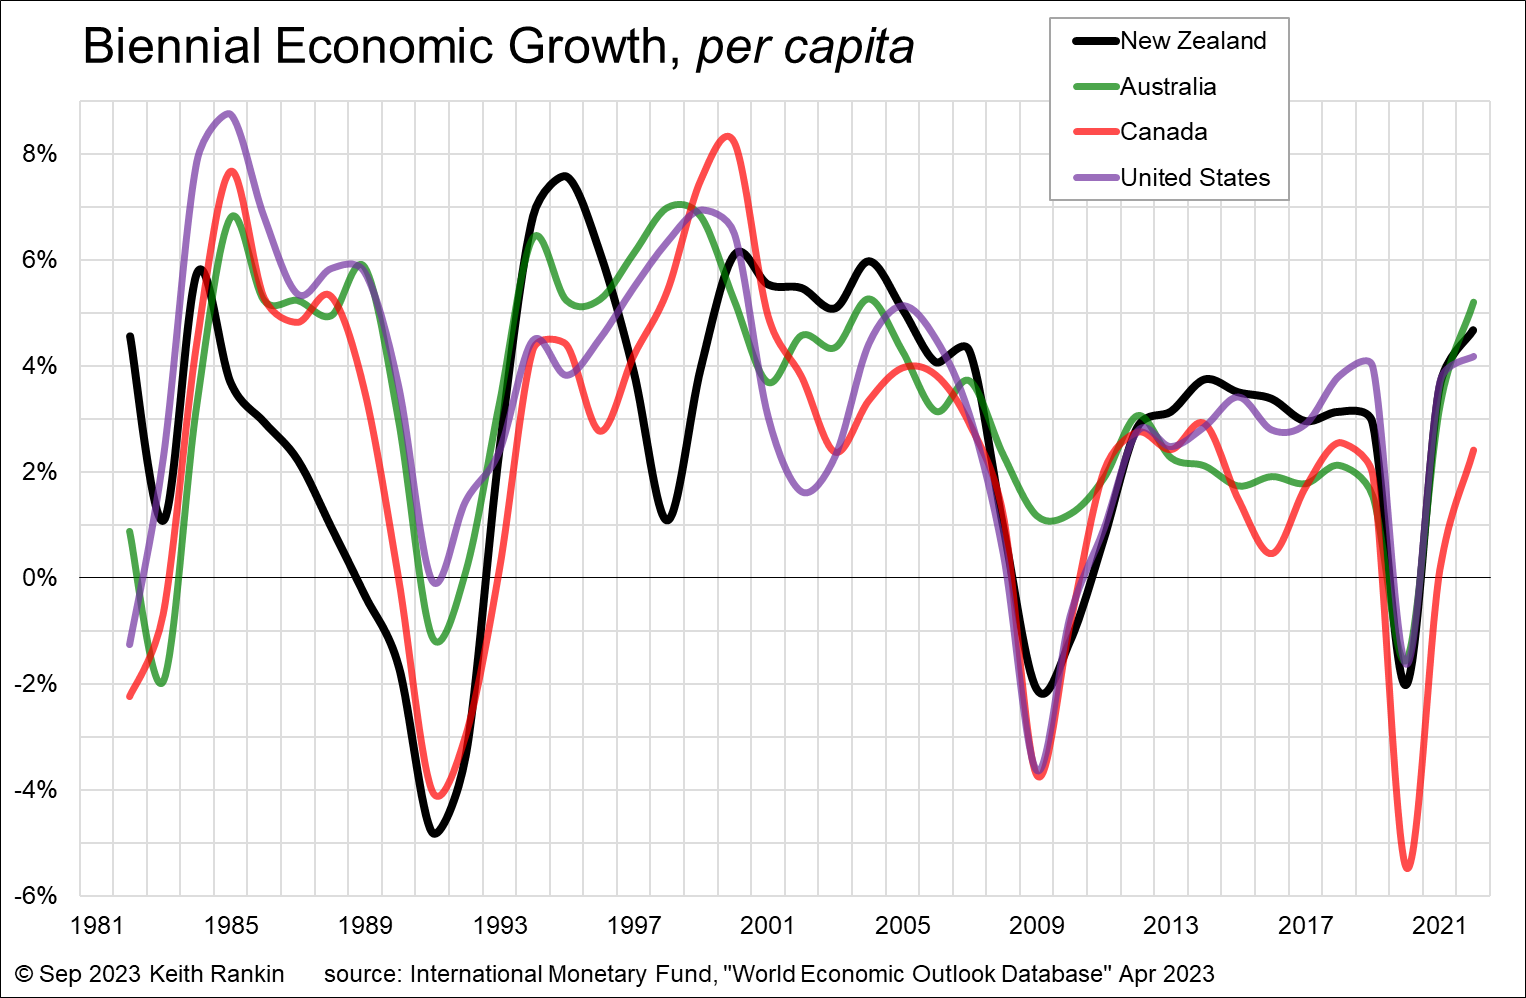
The principal measure of economic success in the mainstream narrative is economic growth. The pointy heads associated with that narrative will correctly point out that its economic growth per capita that matters, and which serves as a crude proxy for ‘living standards’. This conventional wisdom says that annual economic growth of two percent per capita represents the ‘just right’ Goldilocks zone. In the context here, that translates to biennial economic growth of four percent per person in the population.
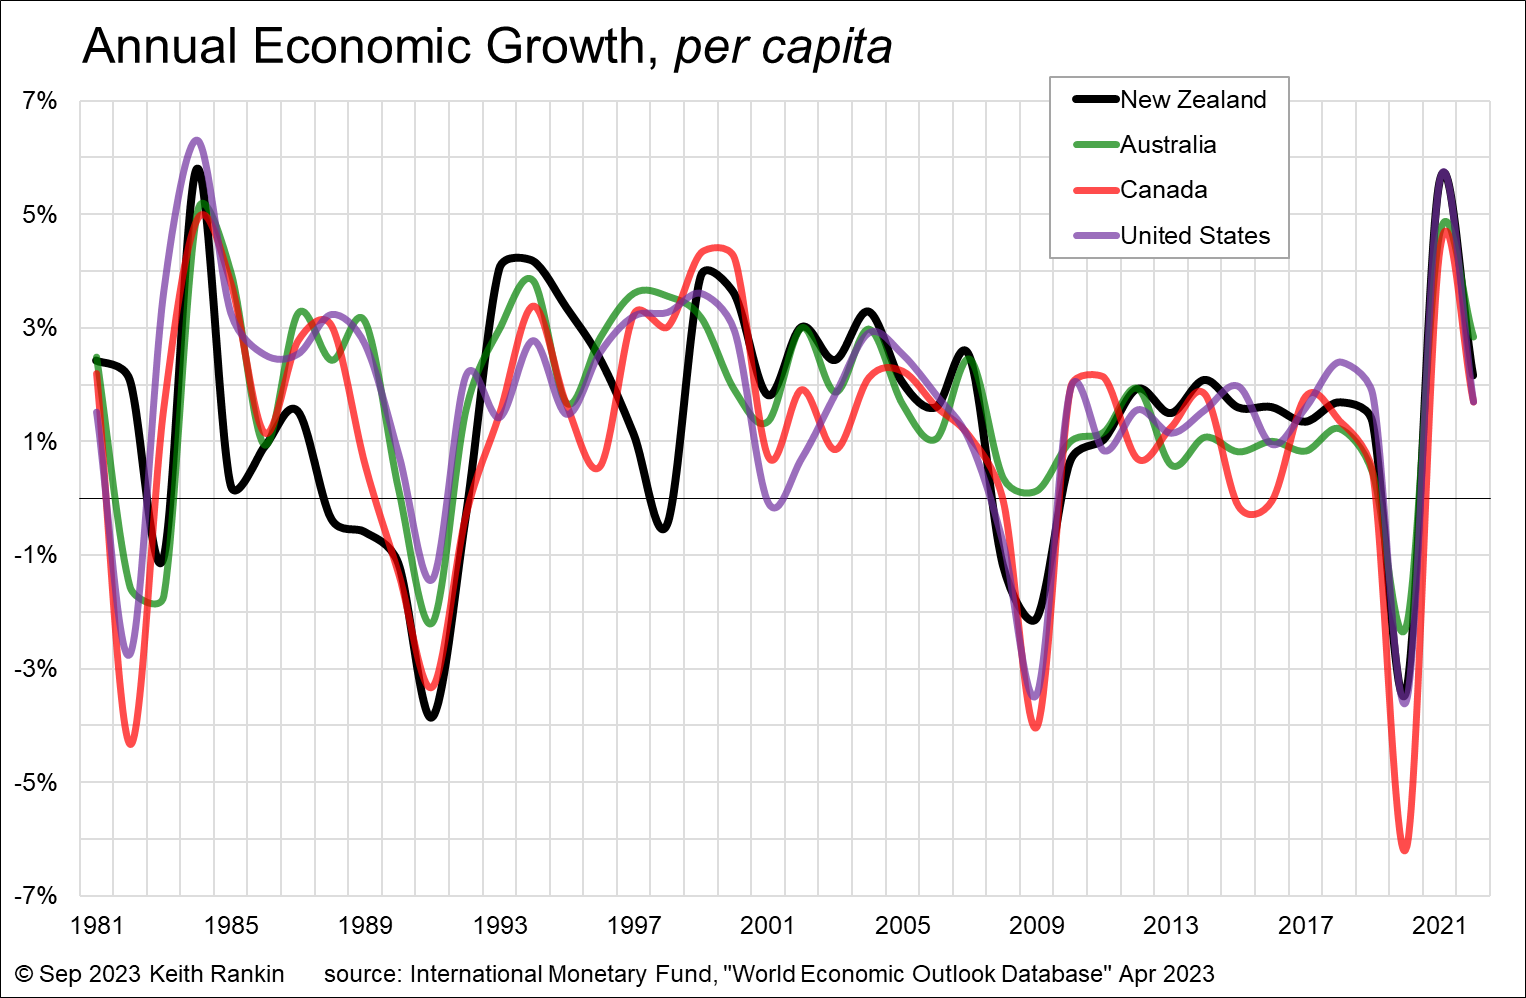
So, what does the data say on the achievement of this? The data used here is sourced from the IMF (International Monetary Fund), noting that the most recent data is subject to revision next month and further revision next year. The IMF dataset for GDP (gross domestic product) starts in 1980; so annual GDP growth data commences in 1981, and biennial growth data commences in 1982. (For biennial data from 1983 to 2022, I compare real GDP for the year concerned with the average of the three prior years. Real GDP is also called ‘GDP at constant prices’, making it a valid measure of marketed output.)
Any time the plotted lines in either chart fall below zero percent indicate a ‘per capita recession’. (Though some technical per capita recessions will have been missed. A technical recession is calculated from bi-annual seasonally adjusted data; that is, a six-month period for which marketed output is less compared to the previous six-months.)
From the first chart, we see that New Zealand has had per capita recessions in 1983, 1988, 1989, 1990, 1991, 1992, 1998, 2008, 2009, and 2020. New Zealand has had more years in per capita recession – ten – than the other countries, with Canada coming next.
The recessions are closely synchronised between the four countries, meaning that the main causes of these events are international, and therefore tell us little about the performance of the national governments concerned. We also note that, in the 2010s, all countries fell below the goldilocks standard for most of that decade. Government policy may contribute to the varying extent of each international recession; comparative analysis points the way to evaluating the contribution of domestic policy.
There are three years in which just one country was in per capita recession. New Zealand’s recession in 1998 was internationally transmitted, a result of the 1997 Asian financial crisis. New Zealand was more vulnerable to a major economic downturn in East Asia than perhaps all other western countries, given the percentage of New Zealand’s output being destined for sale in East Asia. United States was worst hit by the ‘dotcom’ recession of 2001, mainly for reasons domestic to that country. I cannot explain Canada’s recession of 2015 to 1016, though it looks to be related to domestic policymaking in that country.
Some periods of high growth represent a rebound effect; it’s common to have a year or two of unusually high growth after a period of recession, especially after a prolonged recession such as that in New Zealand from 1988 to 1992. We also see this in the United States after 1982, the year the Reaganomics was quietly scuttled.
The second chart, showing biennial economic growth, gives the best overview of differences between the countries. There were three periods in which New Zealand was performing better than the other three countries: the early 1980s (Muldoon years), early 2000s (Clark/Cullen years), and mid-2010s (Key/English years). The first of these was the most politically challenging; New Zealand rode out these early 1980s’ years surprisingly well, with a later, a shorter, and a shallower recession. At that time, New Zealand was adversely affected by rapidly deteriorating terms of trade after 1973.
The standout feature of this chart is the strong correlation between poor economic performance and Rogernomics. The Fourth Labour Government was in power from July 1984 until November 1990. This period – set politically by Finance Minister, Roger Douglas – had profound economic consequences for Aotearoa New Zealand. Before 1985, New Zealand’s per capita incomes were similar to those in these other countries, particularly noting the similarity between New Zealand and Australia.
After the prolonged financial crises (which saw the Bank of New Zealand fail twice) and recession, New Zealand living standards fell significantly below those of Australia. This completely upset the dynamic of the relationship between the two countries. The ensuing disturbed and skewed trans-Tasman dynamic remains as strong as ever, given that New Zealand never secured any gain that could be attributed to the pain of the long Rogernomics recession.
2023
New Zealand is currently in a per capita recession. Despite Statistics New Zealand’s upwards revision of recent GDP data, New Zealand’s increase in output over the last year of 0.9 percent is smaller than the increase in population. According to Statistics New Zealand, in the year to June 2023, New Zealand’s net immigration was 96,000. And the natural increase – births minus deaths – was 19,000. That’s a 2.3% annual increase in population, meaning New Zealand is now in a per capita recession of -1.4%. New Zealand’s tepidly growing economic output must be shared between 2.3% more people.
Of course, economic growth is not everything. I see no signs that many in either the Old Right Elite or the New Left Elite are experiencing falling living standards. Just as neither did in the 1990s. Non-elites are bearing the burden.
The elite narrative is the reason for the lack of economic debate in New Zealand during this election campaign. What we see is a contest between the two ruling elites as to who can outdo the other in their ‘fiscal conservatism’. This is appalling, given that the single biggest cause of the Great Depression of the early 1930s – the most prolonged sequence of per capita recessions last century, beginning in the 1920s – was entrenched fiscal conservatism, practiced by both Social Democratic and Conservative governments in the ‘liberal capitalist’ world order of that time.
It’s as if these elites have relocated to another planet; at least to a wonderland of the mind.
*******
Keith Rankin (keith at rankin dot nz), trained as an economic historian, is a retired lecturer in Economics and Statistics. He lives in Auckland, New Zealand.


