These charts tell a simple story about how the coronavirus pandemic could be a catalyst for the transition to a more sustainable economic future.

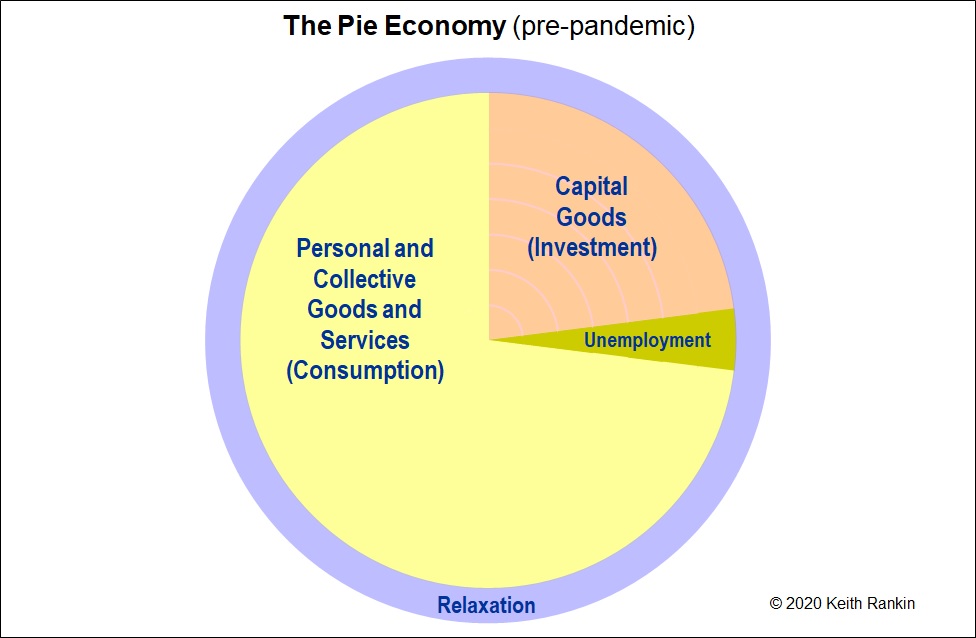
Looking at Chart 1, the gross domestic product (GDP) of the economy is shown as the combination of yellow and orange. (We note that these charts represent another aspect of pie economics; earlier pie charts showed the GDP by looking at its distribution rather than its composition.)
GDP is a measure of market production, not a measure of living standards. Nevertheless, we can picture living standards as the combination of yellow and purple; consumption and leisure. (Orange represents the production of capital goods – such as commercial buildings and machinery – which do not directly contribute to living standards, but which are necessary to maintain or increase economic productivity.)
Unemployment (coloured olive) represents labour made available at current market conditions, but not hired by employers or clients. Strictly, involuntary unemployment is measured by counting unutilised work-hours rather than unutilised people. Nevertheless, we generally measure unemployment as ‘people’, and we accept that normal ‘fully employed’ economies may have four percent of people unemployed. Such economies with ‘full employment’ also tend to have a number of unfilled jobs, but not jobs in the same places – or with the same skill specifications – as the unemployed people.
The absolute maximum capacity of the economy is represented by all four colours combined. But, in normal circumstances, living standards are maximised with a work-leisure balance; and not by replacing all leisure with work.
Some unemployment is practically unavoidable (eg four percent of the labour force), and means that unemployed people should have access to non-labour income. Further, the actual boundary between work and relaxation – essentially the yellow-purple boundary – is not necessarily the optimal boundary. For example, some people may prefer to reduce hours worked and take a proportional pay cut; the only reason that they do not do this is the rigidity of their employment contracts. (Some other people already working fulltime may wish to increase their hours for more pay, and reduce their leisure time; these people would like to give up some leisure so they can have more consumer goods.)

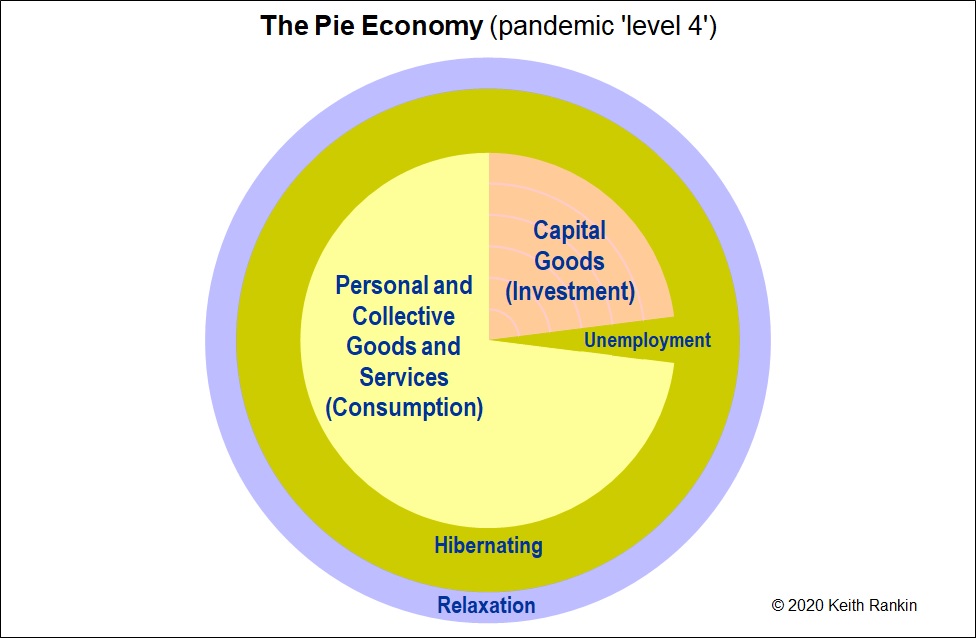
Looking at Chart 2, a pandemic has struck, causing emergency restrictions to be imposed, meaning that parts of the economy have to be suspended; that is, to go into ‘hibernation’. The result is reduced GDP and increased unemployment, labelled ‘hibernation’.
As the period of hibernation progresses, people reassess their choices – in particular, their work-leisure balance. The principal outcome of this personal reflection appears to have been that many people would prefer to work less for pay, and to simplify their lives; they are wanting to work less and are willing to earn less.

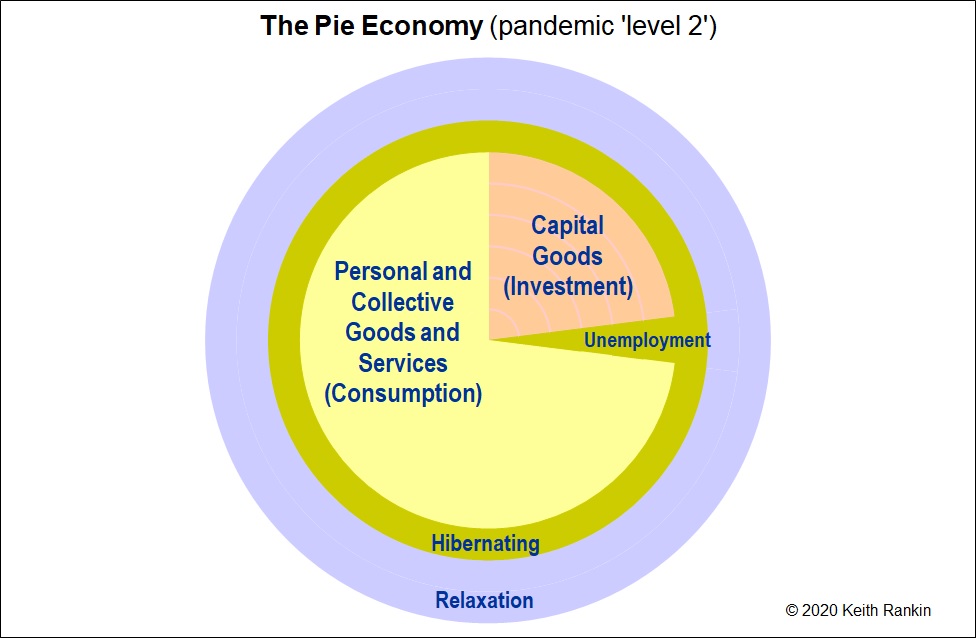
Looking at Chart 3, we see that about half of the new involuntary unemployment (‘hibernation’) has morphed into a preference for more relaxation time, combined with a willingness to adopt a less consumerist lifestyle.

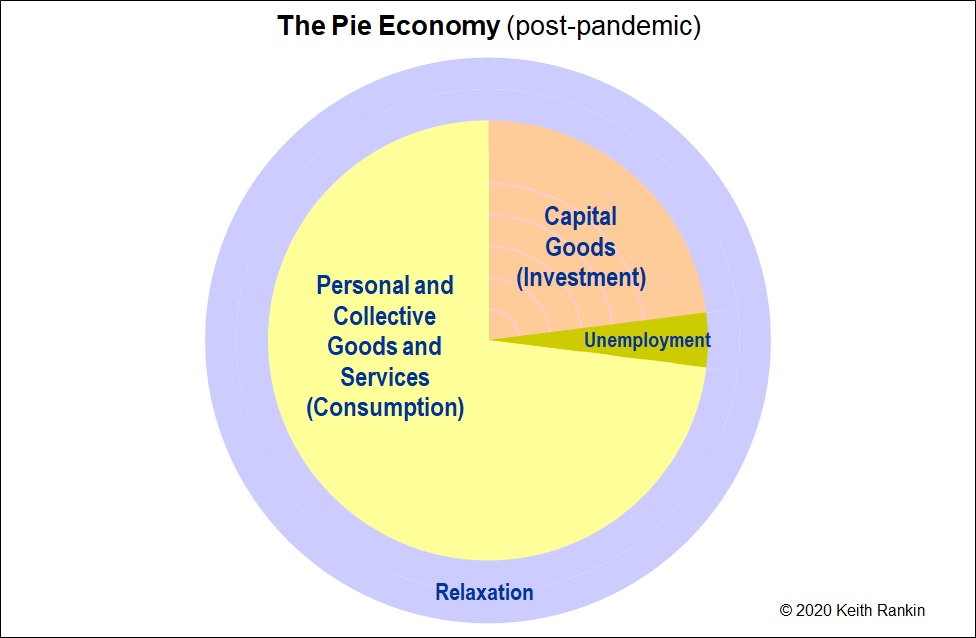
Looking at Chart 4, the pandemic is over, and the economy is free to become normal again. However, as a result of the pandemic the optimal work-leisure balance has changed, compared to Chart 1. (The optimal balance is the one that maximises happiness.)
The remaining hibernation unemployment in Chart 3 becomes employment in Chart 4, leaving only the regular four percent unemployment. Structurally, Chart 4 is just like Chart 1. The really important change is that, post-pandemic, the purple relaxation zone is much larger than it was before the pandemic.
The pandemic has given us a mechanism – a catalyst – that enables us to find our new normal balance. However, to properly achieve that new normal, fiscal and monetary policies will need to be responsive to these changing preferences. Businesses responding to changes in household preferences may be the easy part of the adjustment; getting policymakers to respond to these changes in household preferences may be harder. (That will be the subject of my next contribution to this important discussion.)


