By Keith Rankin
There will almost certainly be another major financial crisis, just like there will be another big earthquake (or, as the Australians would instead say, another big bushfire). We can do much to improve our monitoring of systemic stresses, our awareness of critical-state dynamics, and our before-and-after mitigation processes. Wilful blindness is not a strategy that works well.
In the pre-World War 1 capitalist era, financial crises happened approximately every ten years. Some were worse than others, and they became increasingly global in reach. Melbourne’s massive financial crisis of 1893 was initiated by the financial failure of the Buenos Aires Water Supply and Drainage Company, and the ensuing bank crisis in London. But the economy of Victoria in general and Melbourne in particular was in a critical state then, and would have suffered a financial collapse in the 1890s regardless of those particular precipitating events.
The ‘Long Depression’ of the 1880s in New Zealand was triggered by the collapse of the City of Glasgow Bank in 1879; a collapse that was largely caused by that bank’s unsupervised exposure to rampant land speculation in Canterbury.
This month’s chart suggests that, while there is more than enough unspent income to fuel a financial crisis, the global financial system is not presently in a critical state. We still have learning time.
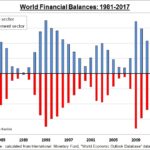
The chart shows global financial balances for the private (non-government) and government sectors from 1981 to 2017. As can be seen clearly, the normal state of the world is for the global private sector to run financial surpluses (ie spending less than its total revenue; this is the ‘private urge to save’), which means that the combined governments of the world must run accommodating deficits (ie spending more than their global total revenues). It’s a zero-sum system. The financial balances of all sectors combined add to zero. This means that the private sector persists in striving for substantial surpluses AND governments persistently seek to avoid deficits, then the capitalist economy finds itself in a state of collapse.
Capitalist collapse is avoided by governments accommodating the private urge to save (Japan’s government provides our best example of accommodating deficits), or by us having periodic private debt‑fuelled spending binges (which enable governments to collect more taxes and run surpluses for a while); binges which lead to acute financial crises within the private sector. Or by our addressing and countering the unsustainable accumulation of financial assets, thereby rendering financial crises unnecessary.
The chart shows three of these private-sector ‘binges’, in the mid-late-1980s, in the late 1990s, and in the mid-late 2000s. The chart shows a different pattern in the mid-late 2010s. The banks struggle to get private households and businesses to spend more, despite record-low interest rates.
Following the 2008 global financial crisis (GFC), the private sector responded to its insolvency by paying down large amounts of debt, and by taking on much less new debt. This private sector objective was partially accommodated by unusually high government deficits (‘fiscal stimulus’) – governments taking on new debt, and running down (or halting contributions to) sovereign wealth funds.
This objective and was somewhat thwarted, however; fiscal stimulus in most countries was never more than a partial accommodation to extreme private caution. The thwarting intensified in 2010 through government ‘fiscal consolidation’ programmes, otherwise known as ‘austerity’. The most egregious example of ‘thwarting’ was the European Union (EU) programme to balance government budgets in the Eurozone countries. Fortunately, governments in the emerging and developing economies were able to increase their deficits, helping the government sector to effectively offset private surpluses in the mid‑2010s.
We can get a sense, from the chart, that world private surpluses (especially those in excess of economic growth rates) represent fuel to be consumed during future crises. A dramatic fall in private balances represents the beginning of an acute financial crisis. In the 1987-92 period, the crisis happened in two parts; New Zealand and the United States (and others) mainly experienced the 1987 shock, while Australia, Japan and Scandinavia experienced their financial crises in 1991. In the 1997 financial crisis, east Asia was most affected, while the United States was little affected until late 2000. In 2008 the crisis was global, although Europe descended into its more chronic crisis around 2011.
The chart also tells us that an early-decade pattern of falling private balances has halted; debt-enabled spending looks unlikely to accelerate in 1919 or 1920. The next major crisis may not occur until the 1927-31 period. And a crisis then likely will be different in character to both the 2008-09 GFC, and the Great Depression of the early 1930s. There may be a critical mass of accumulated private surpluses to fuel the crisis of 2029 (the midpoint of 2027-31), a new ‘yuppie’ generation with little memory of the GFC, and an academic establishment no more equipped to anticipate a sudden change of circumstance than there was in 1928 or in 2007.
The chart shows only one form of dichotomous interconnection – that between private individuals/organisations and governments. There are other financial dichotomies that may prove to be equally as important in the twenty-first century, but generally are much harder to get data for. These include households versus businesses (before the GFC, business surpluses were accommodated by household deficits), advanced current account surplus economies versus developing deficit economies (data is plentiful in this case), young versus old (older persons’ financial surpluses are accommodated by younger persons’ deficits), and rich versus poor (richer persons’ [eg world’s wealthiest five percent] surpluses need to be accommodated by the deficits of the remaining 95 percent as well as the deficits of governments. The cessation of any of these present accommodations can be expected to precipitate financial consequences that we are unprepared for. Unknown unknowns; so long as we persist in a bubble of wilful ignorance.
As private surpluses accumulate (the blue columns in the chart), the tension builds. As the tension builds, accommodating sectors cannot (or, unwittingly, choose not) to play their necessary deficit roles. Debtors default, or otherwise stop spending in favour of debt ‘deleverage’. Asset values diminish as sellers of goods, services and assets struggle to find buyers. Deflation sets in. Real interest rates need to be negative to restore a semblance of balance, meaning that interest rates actually should be more negative than inflation rates. (Negative interest rates since 2014 have already substantially eased financial tensions in non‑Eurozone Switzerland, Sweden and Denmark.)
What can we do today to avert a crisis of liberal capitalism in about ten years’ time?
Governments can commit to long-run deficit targets of two‑three percent per annum. (This is contrary to the fiscal accord that all parties currently in the New Zealand Parliament have signed up to.) Younger people can continue to borrow, and purchase goods/services rather than assets, and then turn to bankruptcy as an accommodating mechanism. (The bankruptcies of persons without assets does represent a systemic rebalancing, albeit an unpalatable one.)
Or other new methods of containing the growth of income inequality (with a view to reducing inequality eventually to 1960s’ levels) – methods other than higher wages, which coexist with unsustainable economic growth – should be adopted. Such methods do exist. It is up to each of us to learn about them; to be willing to see. Don’t wait for the politicians, nor the entrenched political left or right. We, in civil society, need to reclaim our public equity.