Chart analysis by Keith Rankin.
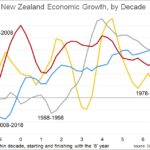
This month’s chart shows New Zealand’s economic growth (annual percentage increase of GDP, rolling annual averages) over four separate ten-year periods, overlayed.
There are some indications of a ten-year cycle. For example, early in the years ending in 9 (meaning, in effect, during the ‘8’ year) New Zealand was in recession three times: 1978/9, 1988/9, 2008/9. 1998/9 was also well below the decadal averages.
And the ‘1’ years were very weak also. These are years of consistent difficulty internationally, whereas the 8-blight has been, as often as not, linked to New Zealand domestic circumstances.
Growth has been consistently highest in the ‘4’ and ‘5’ years.
Overall, average rates of economic growth have been around the 2‑3 percent mark in each decade. However, this does not take account of population growth. Economic growth per person has been lower on average in the most recent decade (2008 to 2018) because the adjustment for population is greater due to more rapid population growth.
While economic growth is an unnuanced measure of economic success, the chart nevertheless shows the substantial ‘flatlining’ from 1985 to 1993 as an unusual feature. This was a near-decade of practically no growth – the decade of the neoliberal experiment. We were told that, once the restructuring was in place, subsequent economic growth rates would be higher. They have not been higher, despite a favourable global trading and investment environment from the early 1990s, compared to global environment during the Muldoon years (1978-84 in this chart).