CoveragePost
August 21, 2020
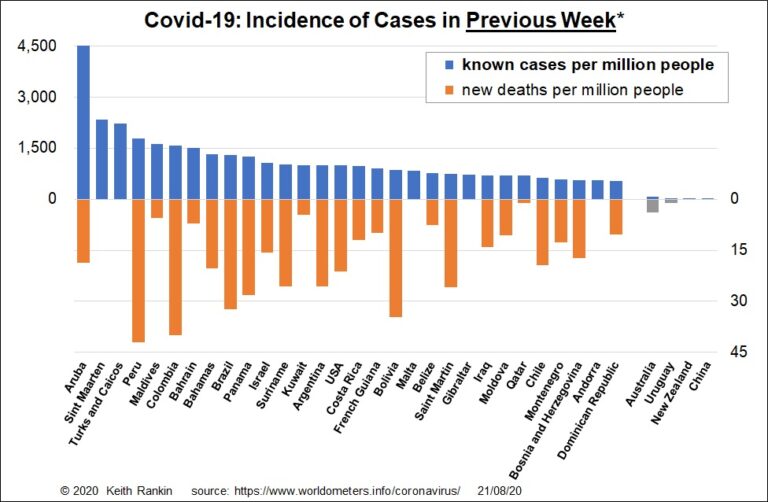
Analysis by Keith Rankin. This week’s chart shows the most current Covid19 outbreaks, including all the little countries. As in March 2020, some of these are the worst affected. It also gives lie to the claim that New Zealand is advantaged by being an island country. In the gold and silver position are Aruba and ... <a title="Keith Rankin Chart Analysis – Covid19: Covid-19 in the Peak of the Northern Hemisphere Tourist Season" class="read-more" href="https://eveningreport.nz/2020/08/21/keith-rankin-chart-analysis-covid19-covid-19-in-the-peak-of-the-northern-hemisphere-tourist-season/" aria-label="Read more about Keith Rankin Chart Analysis – Covid19: Covid-19 in the Peak of the Northern Hemisphere Tourist Season">Read more</a>
CoveragePost
August 20, 2020
Analysis by Keith Rankin. Early Identification and Action We are now learning, from Covid19, one thing above all else. With epidemics, it is early identification and action that matters. When our Prime Minister, Jacinda Ardern, says that New Zealand’s government approach is to “go hard and go early”, she is only partly correct. What matters ... <a title="Keith Rankin – Epidemic Costs and Responses: Coronavirus and Tuberculosis" class="read-more" href="https://eveningreport.nz/2020/08/20/keith-rankin-epidemic-costs-and-responses-coronavirus-and-tuberculosis/" aria-label="Read more about Keith Rankin – Epidemic Costs and Responses: Coronavirus and Tuberculosis">Read more</a>
CoveragePost
August 14, 2020
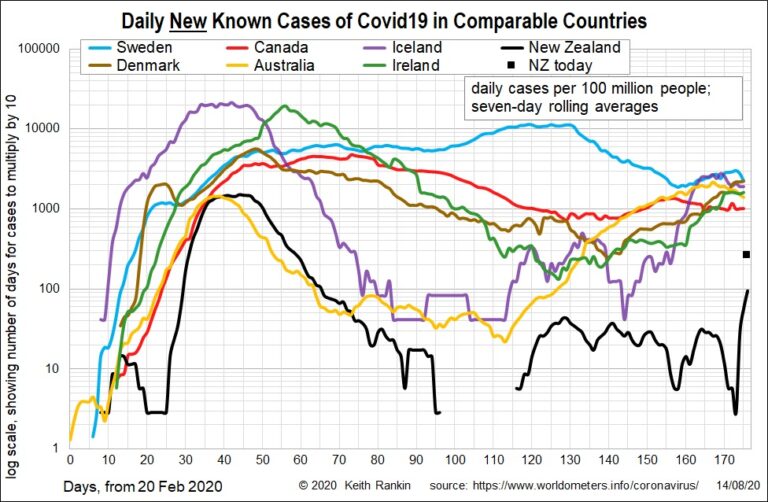
Analysis by Keith Rankin. Today’s chart compares this week’s Covid-19 outbreak in New Zealand with the latest case-data from other comparable countries. Note that the data plots new daily cases, smoothed using seven-day averages. However, the ‘black square’ represents New Zealand’s most recent daily total of new cases, at 260 per 100 million people (which ... <a title="Keith Rankin Chart Analysis – Covid19: Comparing New Zealand’s Outbreak with Comparable Countries" class="read-more" href="https://eveningreport.nz/2020/08/14/keith-rankin-chart-analysis-covid19-comparing-new-zealands-outbreak-with-comparable-countries/" aria-label="Read more about Keith Rankin Chart Analysis – Covid19: Comparing New Zealand’s Outbreak with Comparable Countries">Read more</a>
CoveragePost
August 7, 2020
Analysis by Keith Rankin. The known incidences of Covid19 in Spain, Belgium and Sweden are similar, although Sweden lagged for a while before overtaking the other two. In deaths, Sweden is slightly lower than Spain and about 30% lower than Belgium. Belgium, after little San Marino, is still the country with the highest deaths per ... <a title="Keith Rankin’s Chart Analysis – Covid19: Comparing Australian Outbreak with High Incidence European Countries" class="read-more" href="https://eveningreport.nz/2020/08/07/keith-rankins-chart-analysis-covid19-comparing-australian-outbreak-with-high-incidence-european-countries/" aria-label="Read more about Keith Rankin’s Chart Analysis – Covid19: Comparing Australian Outbreak with High Incidence European Countries">Read more</a>
CoveragePost
July 31, 2020
Analysis by Keith Rankin. This week’s first chart shows the incidence of new Covid19 cases in countries with more than 7,500,000 people. (Hong Kong is the smallest country to feature.) It shows that, while very serious, the Australian outbreak is far from unique. The outbreak in Israel, for example, is much worse. Generally, countries with ... <a title="Keith Rankin Chart Analysis – Covid19: Latest Incidences for Large Countries" class="read-more" href="https://eveningreport.nz/2020/07/31/keith-rankin-chart-analysis-covid19-latest-incidences-for-large-countries/" aria-label="Read more about Keith Rankin Chart Analysis – Covid19: Latest Incidences for Large Countries">Read more</a>
CoveragePost
July 23, 2020
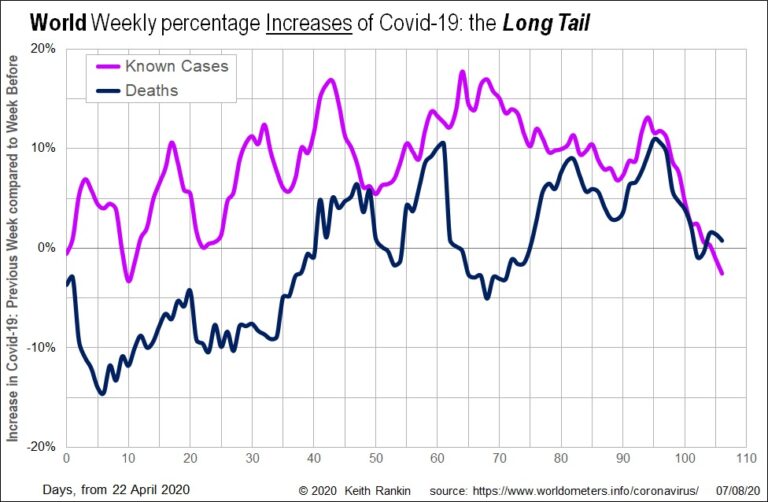
Analysis by Keith Rankin. This week’s first chart shows the huge European wave of Covid-19 in March. At its exponential peak, the chart shows world Covid19 weekly deaths increasing by 260 percent in the second week of March, compared to March’s first week. This European wave contrasts sharply with the last week of February, when ... <a title="Keith Rankin Chart Analysis – Global Covid19: European Wave and Rising Tail" class="read-more" href="https://eveningreport.nz/2020/07/23/keith-rankin-chart-analysis-global-covid19-european-wave-and-rising-tail/" aria-label="Read more about Keith Rankin Chart Analysis – Global Covid19: European Wave and Rising Tail">Read more</a>
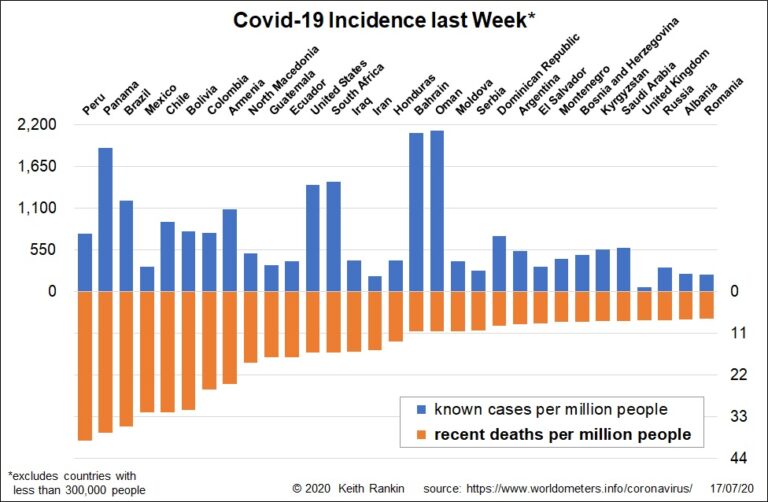
CoveragePost
July 17, 2020
Analysis by Keith Rankin. This chart orders countries by their Covid19 death rates in the seven days to 16 July. The seven worst countries are in Latin America; all except Panama being large countries. Two other large Latin American countries (Guatemala and Ecuador) are in the top 11 for recent Covid19 deaths. Of the larger countries ... <a title="Keith Rankin Chart Analysis – Covid19: Recent Cases and Deaths" class="read-more" href="https://eveningreport.nz/2020/07/17/keith-rankin-chart-analysis-covid19-recent-cases-and-deaths/" aria-label="Read more about Keith Rankin Chart Analysis – Covid19: Recent Cases and Deaths">Read more</a>
CoveragePost
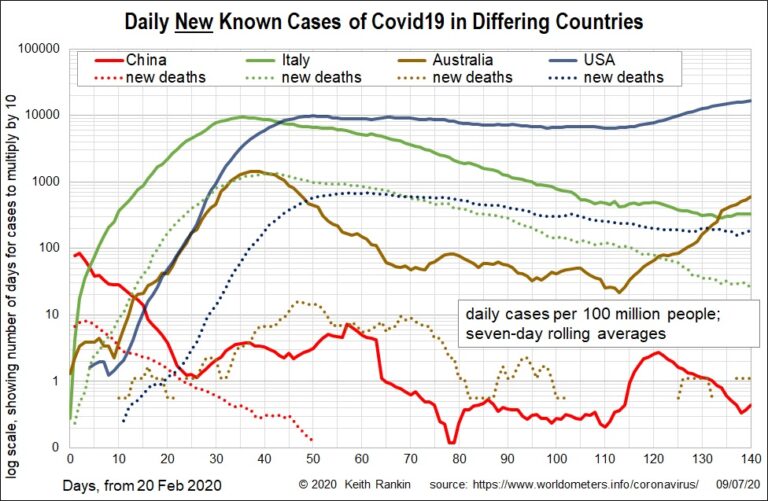
July 10, 2020
Analysis by Keith Rankin. These charts look at Covid19 incidence in China (the most important first-wave country, with a limited second wave), Italy (the lead second-wave country), and USA and Australia (second-wave countries – drawing their caseload from Europe – with limited first-wave exposure from Asia in January and February). Chart 1 shows the first-wave in ... <a title="Keith Rankin Chart Analysis – Covid19: Comparing China, Italy, USA and Australia" class="read-more" href="https://eveningreport.nz/2020/07/10/keith-rankin-chart-analysis-covid19-comparing-china-italy-usa-and-australia/" aria-label="Read more about Keith Rankin Chart Analysis – Covid19: Comparing China, Italy, USA and Australia">Read more</a>
CoveragePost
June 30, 2020
Op-Ed by Armida Salsiah Alisjahbana – United Nations Under-Secretary-General and Executive Secretary of the UN Economic and Social Commission for Asia and the Pacific. Developing countries of Asia and the Pacific are experiencing unbalanced tolls of the COVID-19 pandemic. Grim milestones in infections and deaths have left countless devastated. Yet, we must look at the economic ... <a title="Submission – Sustainable tourism and fisheries key to growth in post-COVID Pacific" class="read-more" href="https://eveningreport.nz/2020/06/30/submission-sustainable-tourism-and-fisheries-key-to-growth-in-post-covid-pacific/" aria-label="Read more about Submission – Sustainable tourism and fisheries key to growth in post-COVID Pacific">Read more</a>
CoveragePost
June 25, 2020
Analysis by Keith Rankin. We get a very biased picture of which countries have had the most experience of Covid19. It’s because the mainstream media almost never adjust their figures for population. So, in June, we keep hearing about United States and Brazil, but that’s mainly because they are very populous countries. It’s also because they ... <a title="Keith Rankin’s Chart Analysis – Covid19: Summary of Covid19 Incidence as of mid-June 2020" class="read-more" href="https://eveningreport.nz/2020/06/25/keith-rankins-chart-analysis-covid19-summary-of-covid19-incidence-as-of-mid-june-2020/" aria-label="Read more about Keith Rankin’s Chart Analysis – Covid19: Summary of Covid19 Incidence as of mid-June 2020">Read more</a>
CoveragePost
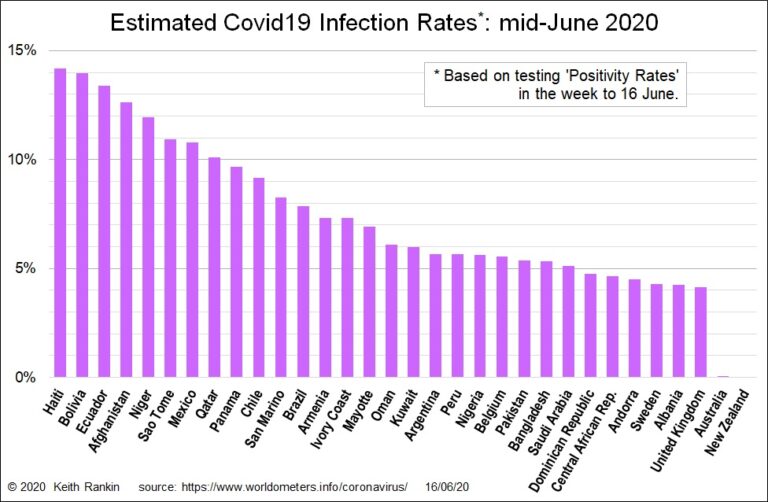
June 17, 2020
Analysis by Keith Rankin. The above chart shows my estimates for the actual infection rates of Covid19 for all countries with an (estimated) infection rate of above four percent of their population. Plus, Australia and New Zealand. The principal method of estimation is to use the testing ‘positivity rate’. If the average positivity rate over the ... <a title="Keith Rankin Chart Analysis – Covid19: Estimates of Covid19 Incidence as of mid-June 2020" class="read-more" href="https://eveningreport.nz/2020/06/17/keith-rankin-chart-analysis-covid19-estimates-of-covid19-incidence-as-of-mid-june-2020/" aria-label="Read more about Keith Rankin Chart Analysis – Covid19: Estimates of Covid19 Incidence as of mid-June 2020">Read more</a>
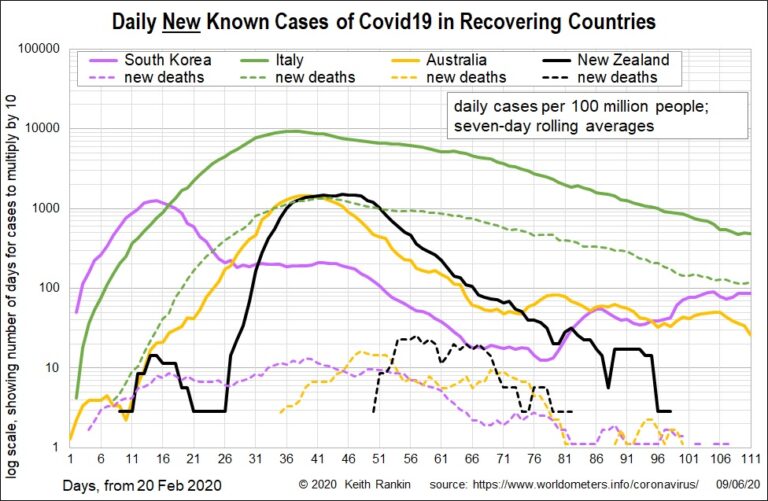
CoveragePost
June 10, 2020
Analysis by Keith Rankin. These charts plot seven-day rolling averages. It means that the most recent death and case incidences of Covid19 is the average of new cases for the seven days ended 9 June 2020. The New Zealand data looks incomplete, but that’s because it is now zero; New Zealand is recovered, not recovering. Contrast ... <a title="Keith Rankin Chart Analysis – Covid19: Cases and Deaths over Time for Recovering and High-Incidence Countries" class="read-more" href="https://eveningreport.nz/2020/06/10/keith-rankin-chart-analysis-covid19-cases-and-deaths-over-time-for-recovering-and-high-incidence-countries/" aria-label="Read more about Keith Rankin Chart Analysis – Covid19: Cases and Deaths over Time for Recovering and High-Incidence Countries">Read more</a>