CoveragePost
June 9, 2020
Analysis by Keith Rankin. How many current pandemics? The word ‘pandemic’ is not entirely defined on narrow public health criteria. (Likewise, an economic depression has no technical definition.) In an important sense it is a word of history, a word to describe significant health events of the past that had substantial diffusion beyond any particular locality. ... <a title="Keith Rankin Analysis – A Plague of Pandemics, including a Pandemic of Plague" class="read-more" href="https://eveningreport.nz/2020/06/09/keith-rankin-analysis-a-plague-of-pandemics-including-a-pandemic-of-plague/" aria-label="Read more about Keith Rankin Analysis – A Plague of Pandemics, including a Pandemic of Plague">Read more</a>
CoveragePost
May 31, 2020
Analysis by Keith Rankin. The large western economies account for by far the most covid19 deaths in the world. Even Germany, with a covid19 death incidence of 100 per million is well above the world average to date of 50 deaths per million people. Of these large countries, only the United States looks likely to ... <a title="Keith Rankin Chart Analysis – Covid19: Deaths and Cases to the end of May 2020" class="read-more" href="https://eveningreport.nz/2020/05/31/keith-rankin-chart-analysis-covid19-deaths-and-cases-to-the-end-of-may-2020/" aria-label="Read more about Keith Rankin Chart Analysis – Covid19: Deaths and Cases to the end of May 2020">Read more</a>
CoveragePost
May 30, 2020
Analysis by Keith Rankin. Sweden has lost 400 of its ten million people to Covid 19 in the week to 28 May. And there is little sign, yet, of a significant slowdown in deaths. Sweden’s weekly death rate has been this high for the last eight weeks; ie since the beginning of April. It would ... <a title="Keith Rankin Chart Analysis – Covid19: Deaths and Cases in the last week of May 2020" class="read-more" href="https://eveningreport.nz/2020/05/30/keith-rankin-chart-analysis-covid19-deaths-and-cases-in-the-last-week-of-may-2020/" aria-label="Read more about Keith Rankin Chart Analysis – Covid19: Deaths and Cases in the last week of May 2020">Read more</a>
CoveragePost
May 22, 2020
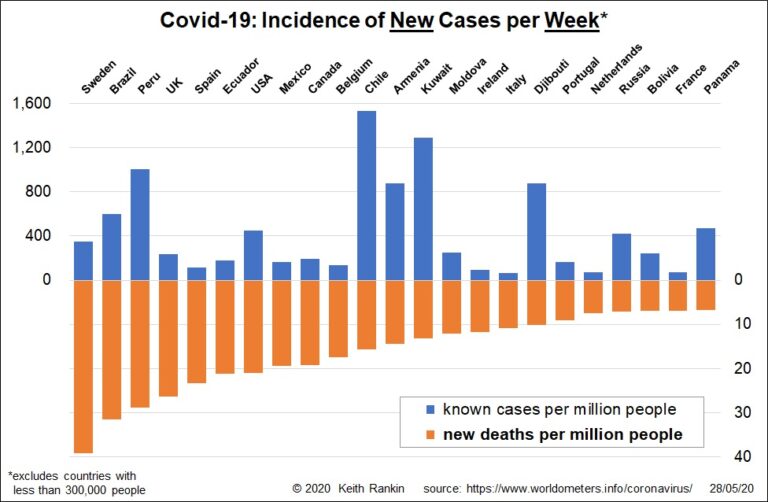
Analysis by Keith Rankin. Covid19 case incidence is a reflection of both the actual infection rate, and the extent to which infections have been reported. Thus, countries like Sweden and Brazil with low testing rates have actual infection rates substantially higher than reported. Qatar is so high in part because, like Iceland, testing rates have ... <a title="Keith Rankin Chart Analysis – Covid19: Cumulative Cases and Deaths" class="read-more" href="https://eveningreport.nz/2020/05/22/keith-rankin-chart-analysis-covid19-cumulative-cases-and-deaths/" aria-label="Read more about Keith Rankin Chart Analysis – Covid19: Cumulative Cases and Deaths">Read more</a>
CoveragePost
May 15, 2020
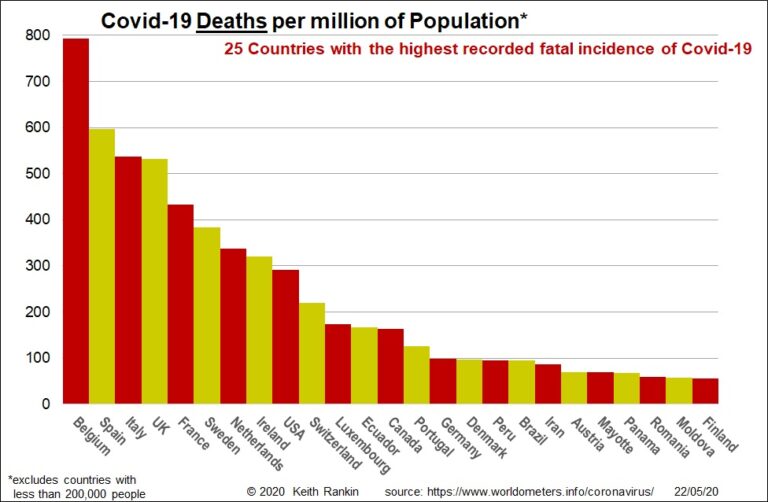
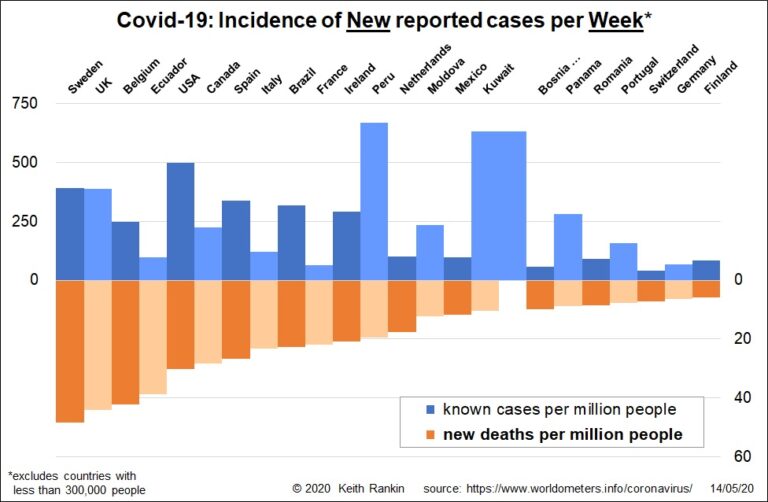
Analysis by Keith Rankin. Today’s first summary chart looks at reported Covid19 cases and deaths over the seven days to 14 May. It is sorted into a Covid19 ‘deaths league’. Sweden now leads the world for acknowledged Covid19 deaths, closely followed by United Kingdom and Belgium. While Netherlands is showing well below Sweden and Belgium, ... <a title="Keith Rankin’s Chart Analysis – Covid19: Weekly Summary" class="read-more" href="https://eveningreport.nz/2020/05/15/keith-rankins-chart-analysis-covid19-weekly-summary/" aria-label="Read more about Keith Rankin’s Chart Analysis – Covid19: Weekly Summary">Read more</a>
CoveragePost
May 8, 2020
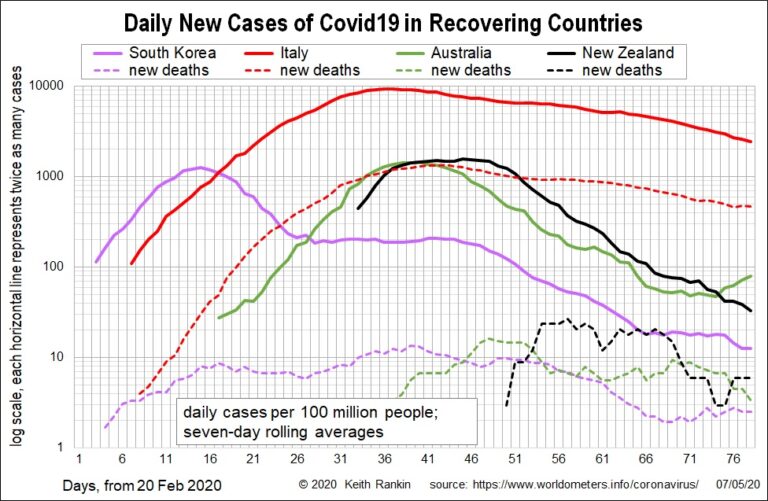
Analysis by Keith Rankin. This chart shows four recovering countries, including two of the first major outbreaks after China (South Korea and Italy), and the putative Australasian bubble. The chart shows daily average new cases, using seven-day rolling averages. Thus Italy is approaching 2000 new cases a day per 100 million people. Because Italy has ... <a title="Keith Rankin’s Chart Analysis – Covid19: Long Tail and Long Head" class="read-more" href="https://eveningreport.nz/2020/05/08/keith-rankins-chart-analysis-covid19-long-tail-and-long-head/" aria-label="Read more about Keith Rankin’s Chart Analysis – Covid19: Long Tail and Long Head">Read more</a>
CoveragePost
May 5, 2020
Analysis by Keith Rankin. Surviving the Black Flu It has been interesting for me to look back and investigate the Black Flu pandemic of 1918. The 1918 pandemic is widely regarded to have been the world’s worst pandemic since the Black Death of the late 1340s. (It was commonly known as the ‘Spanish Flu’, but this ... <a title="Keith Rankin Analysis – Smart Treatments in a Pandemic; Lessons from the Black Flu" class="read-more" href="https://eveningreport.nz/2020/05/05/keith-rankin-analysis-smart-treatments-in-a-pandemic-lessons-from-the-black-flu/" aria-label="Read more about Keith Rankin Analysis – Smart Treatments in a Pandemic; Lessons from the Black Flu">Read more</a>
CoveragePost
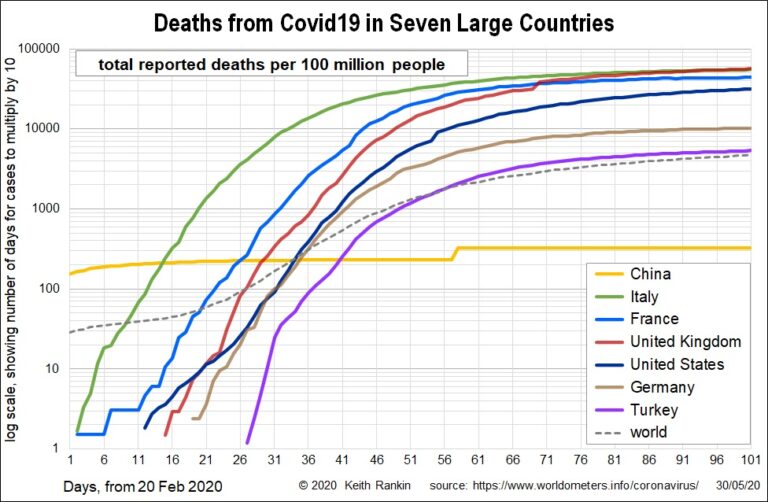
May 1, 2020
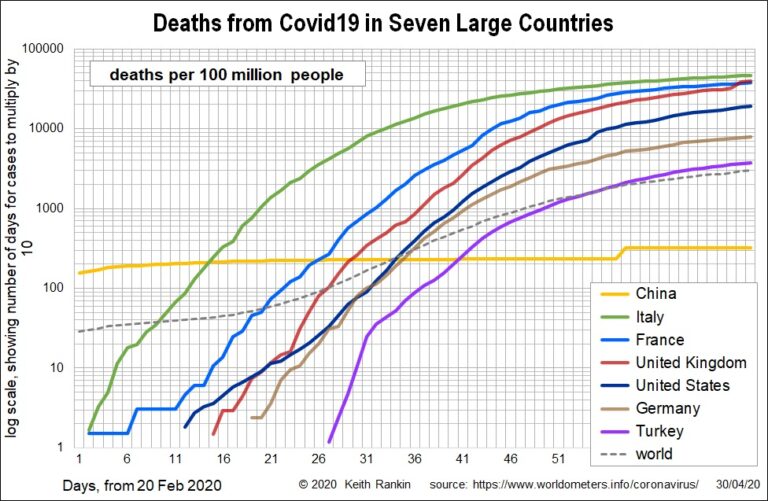
Analysis by Keith Rankin. At the end of this week, I have represented the latest summary charts with a log 10 scale, rather than the previous log 2 scale. This means that, as well as accurately showing the exponential growth pattern, the charts now emphasise ten-fold increases of Covid19 fatalities. At the top of the ... <a title="Keith Rankin Chart Analysis – Covid19: April Summary Charts" class="read-more" href="https://eveningreport.nz/2020/05/01/keith-rankin-chart-analysis-covid19-april-summary-charts/" aria-label="Read more about Keith Rankin Chart Analysis – Covid19: April Summary Charts">Read more</a>
CoveragePost
April 29, 2020
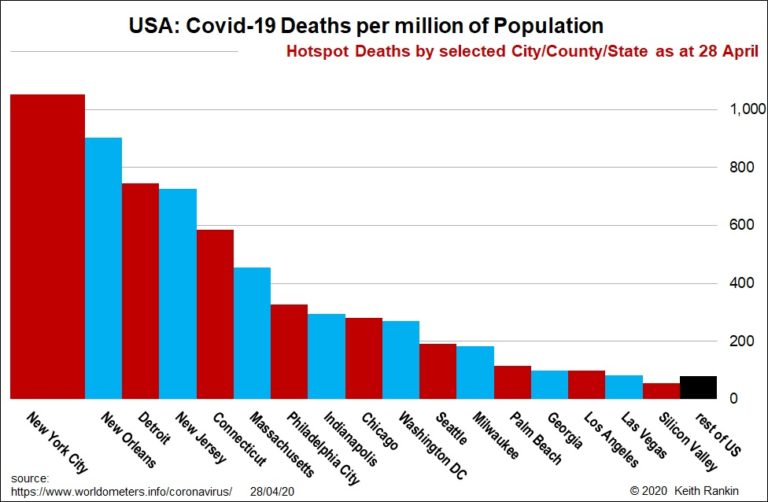
Analysis by Keith Rankin. At the end of last month I published a chart showing the main features of Covid19 deaths in the United States. Today I publish an update, which has most of the same American places. At the end of last month, New Orleans (125 deaths per million people) had the worst outbreak, ... <a title="Keith Rankin Chart Analysis – Covid19: United States’ Update" class="read-more" href="https://eveningreport.nz/2020/04/29/keith-rankin-chart-analysis-covid19-united-states-update/" aria-label="Read more about Keith Rankin Chart Analysis – Covid19: United States’ Update">Read more</a>
CoveragePost
April 28, 2020
Analysis by Keith Rankin. Predictions It is dangerous to predict how pandemics will pan out. In Covid19 by the Numbers, Anatole Kaletsky (writing for Project Syndicate on 10 March 2020) used what looked like advanced analysis to conclude that at most 750,000 outside of China would contract Covid19. (He admitted he was wide of the ... <a title="Keith Rankin Analysis – Will Covid-19 remain a First-World Disease?" class="read-more" href="https://eveningreport.nz/2020/04/28/keith-rankin-analysis-will-covid-19-remain-a-first-world-disease/" aria-label="Read more about Keith Rankin Analysis – Will Covid-19 remain a First-World Disease?">Read more</a>
CoveragePost
April 21, 2020
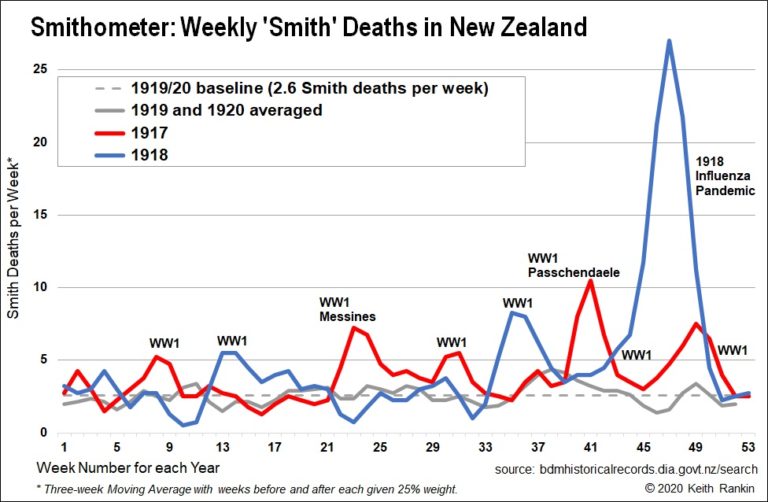
Analysis by Keith Rankin Today’s chart looks back to the years 1917 to 1920, using a sampling device I call the ‘Smithometer’. I have counted the weekly deaths of all people named Smith, from the beginning of 1917 to the end of 1920. At that time New Zealand was a country of 1.2 million people. ... <a title="Keith Rankin’s Chart Analysis – The Smithometer: New Zealand’s mortality during the 1918 Influenza Pandemic" class="read-more" href="https://eveningreport.nz/2020/04/21/keith-rankins-chart-analysis-the-smithometer-new-zealands-mortality-during-the-1918-influenza-pandemic/" aria-label="Read more about Keith Rankin’s Chart Analysis – The Smithometer: New Zealand’s mortality during the 1918 Influenza Pandemic">Read more</a>
CoveragePost
April 17, 2020
Analysis by Keith Rankin Today’s first chart looks at death rates for six major countries. We see that Spain has overtaken Italy, and that France and United Kingdom are likely to catch up with these in a week. We also note that United Kingdom death rates, as reported have been understated; these are basically hospital ... <a title="Keith Rankin’s Chart Analysis – Covid19: Weekly Summary Charts" class="read-more" href="https://eveningreport.nz/2020/04/17/keith-rankins-chart-analysis-covid19-weekly-summary-charts/" aria-label="Read more about Keith Rankin’s Chart Analysis – Covid19: Weekly Summary Charts">Read more</a>