CoveragePost
June 30, 2020
Op-Ed by Armida Salsiah Alisjahbana – United Nations Under-Secretary-General and Executive Secretary of the UN Economic and Social Commission for Asia and the Pacific. Developing countries of Asia and the Pacific are experiencing unbalanced tolls of the COVID-19 pandemic. Grim milestones in infections and deaths have left countless devastated. Yet, we must look at the economic ... <a title="Submission – Sustainable tourism and fisheries key to growth in post-COVID Pacific" class="read-more" href="https://eveningreport.nz/2020/06/30/submission-sustainable-tourism-and-fisheries-key-to-growth-in-post-covid-pacific/" aria-label="Read more about Submission – Sustainable tourism and fisheries key to growth in post-COVID Pacific">Read more</a>
CoveragePost
June 29, 2020
By Liu Chen, RNZ News reporter The covid-19 coronavirus pandemic and subsequent lockdown has been tough on the mental wellbeing of Asian New Zealanders, according to new research. The New Zealand Asian Mental Health and Well-being report, commissioned by charity Asian Family Services, found high levels of anxiety and nervousness, as well as racism. The ... <a title="Covid survey shows high anxiety and depression among Asian Kiwis" class="read-more" href="https://eveningreport.nz/2020/06/29/covid-survey-shows-high-anxiety-and-depression-among-asian-kiwis/" aria-label="Read more about Covid survey shows high anxiety and depression among Asian Kiwis">Read more</a>
CoveragePost
June 17, 2020
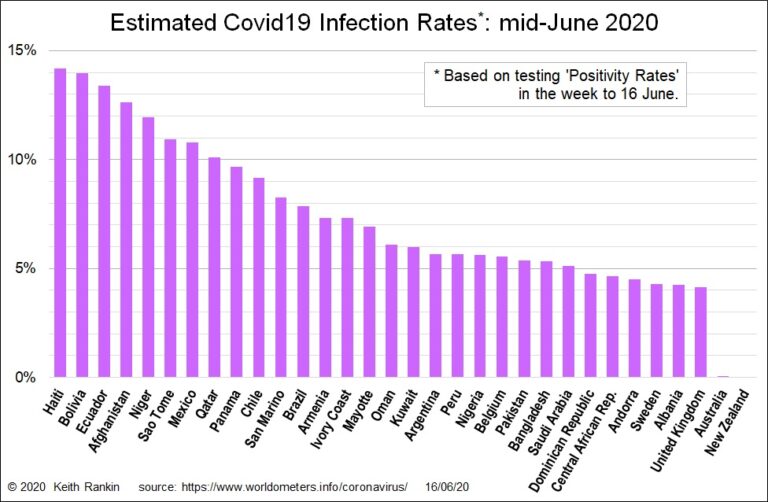
Analysis by Keith Rankin. The above chart shows my estimates for the actual infection rates of Covid19 for all countries with an (estimated) infection rate of above four percent of their population. Plus, Australia and New Zealand. The principal method of estimation is to use the testing ‘positivity rate’. If the average positivity rate over the ... <a title="Keith Rankin Chart Analysis – Covid19: Estimates of Covid19 Incidence as of mid-June 2020" class="read-more" href="https://eveningreport.nz/2020/06/17/keith-rankin-chart-analysis-covid19-estimates-of-covid19-incidence-as-of-mid-june-2020/" aria-label="Read more about Keith Rankin Chart Analysis – Covid19: Estimates of Covid19 Incidence as of mid-June 2020">Read more</a>
CoveragePost
June 10, 2020
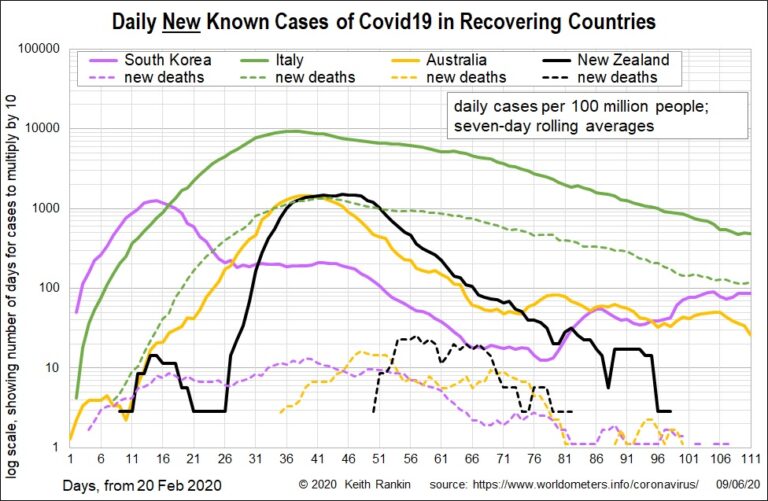
Analysis by Keith Rankin. These charts plot seven-day rolling averages. It means that the most recent death and case incidences of Covid19 is the average of new cases for the seven days ended 9 June 2020. The New Zealand data looks incomplete, but that’s because it is now zero; New Zealand is recovered, not recovering. Contrast ... <a title="Keith Rankin Chart Analysis – Covid19: Cases and Deaths over Time for Recovering and High-Incidence Countries" class="read-more" href="https://eveningreport.nz/2020/06/10/keith-rankin-chart-analysis-covid19-cases-and-deaths-over-time-for-recovering-and-high-incidence-countries/" aria-label="Read more about Keith Rankin Chart Analysis – Covid19: Cases and Deaths over Time for Recovering and High-Incidence Countries">Read more</a>
CoveragePost
June 9, 2020
Analysis by Keith Rankin. How many current pandemics? The word ‘pandemic’ is not entirely defined on narrow public health criteria. (Likewise, an economic depression has no technical definition.) In an important sense it is a word of history, a word to describe significant health events of the past that had substantial diffusion beyond any particular locality. ... <a title="Keith Rankin Analysis – A Plague of Pandemics, including a Pandemic of Plague" class="read-more" href="https://eveningreport.nz/2020/06/09/keith-rankin-analysis-a-plague-of-pandemics-including-a-pandemic-of-plague/" aria-label="Read more about Keith Rankin Analysis – A Plague of Pandemics, including a Pandemic of Plague">Read more</a>
CoveragePost
May 31, 2020
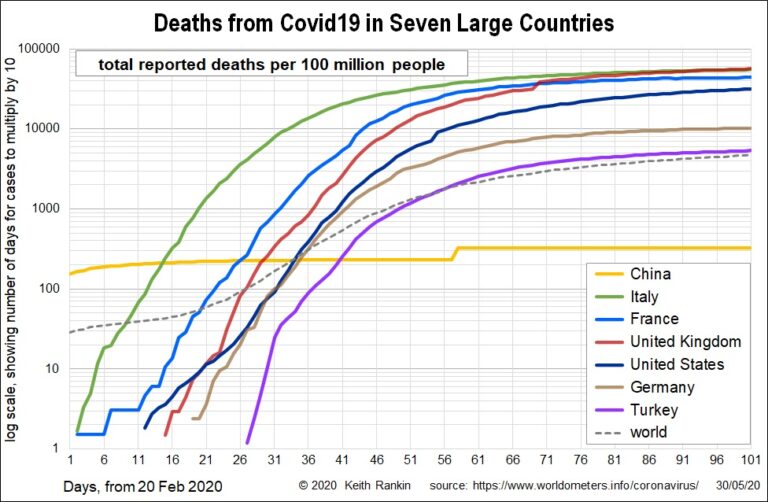
Analysis by Keith Rankin. The large western economies account for by far the most covid19 deaths in the world. Even Germany, with a covid19 death incidence of 100 per million is well above the world average to date of 50 deaths per million people. Of these large countries, only the United States looks likely to ... <a title="Keith Rankin Chart Analysis – Covid19: Deaths and Cases to the end of May 2020" class="read-more" href="https://eveningreport.nz/2020/05/31/keith-rankin-chart-analysis-covid19-deaths-and-cases-to-the-end-of-may-2020/" aria-label="Read more about Keith Rankin Chart Analysis – Covid19: Deaths and Cases to the end of May 2020">Read more</a>
CoveragePost
May 30, 2020
Analysis by Keith Rankin. Sweden has lost 400 of its ten million people to Covid 19 in the week to 28 May. And there is little sign, yet, of a significant slowdown in deaths. Sweden’s weekly death rate has been this high for the last eight weeks; ie since the beginning of April. It would ... <a title="Keith Rankin Chart Analysis – Covid19: Deaths and Cases in the last week of May 2020" class="read-more" href="https://eveningreport.nz/2020/05/30/keith-rankin-chart-analysis-covid19-deaths-and-cases-in-the-last-week-of-may-2020/" aria-label="Read more about Keith Rankin Chart Analysis – Covid19: Deaths and Cases in the last week of May 2020">Read more</a>
CoveragePost
May 22, 2020
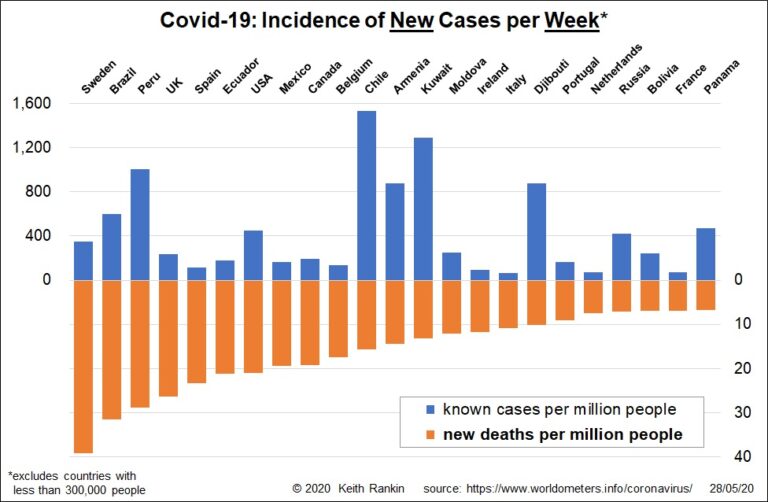
Analysis by Keith Rankin. Covid19 case incidence is a reflection of both the actual infection rate, and the extent to which infections have been reported. Thus, countries like Sweden and Brazil with low testing rates have actual infection rates substantially higher than reported. Qatar is so high in part because, like Iceland, testing rates have ... <a title="Keith Rankin Chart Analysis – Covid19: Cumulative Cases and Deaths" class="read-more" href="https://eveningreport.nz/2020/05/22/keith-rankin-chart-analysis-covid19-cumulative-cases-and-deaths/" aria-label="Read more about Keith Rankin Chart Analysis – Covid19: Cumulative Cases and Deaths">Read more</a>
CoveragePost
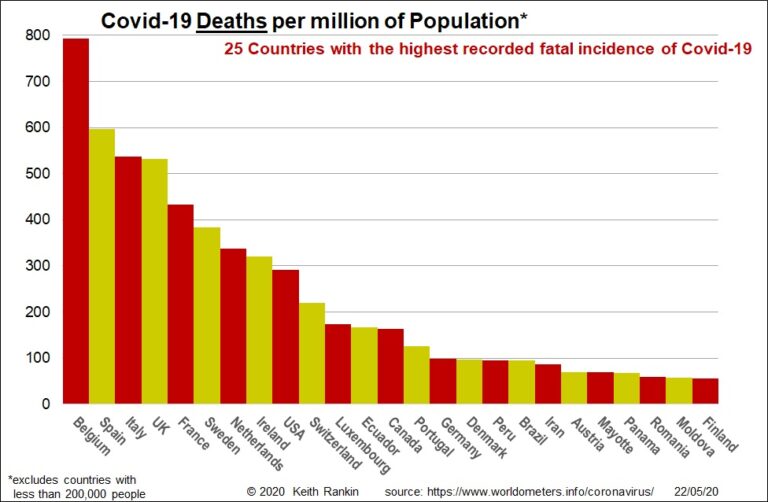
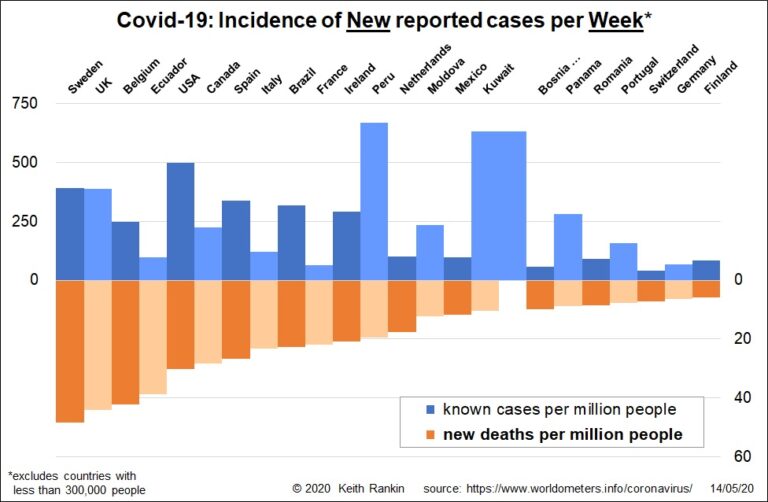
May 15, 2020
Analysis by Keith Rankin. Today’s first summary chart looks at reported Covid19 cases and deaths over the seven days to 14 May. It is sorted into a Covid19 ‘deaths league’. Sweden now leads the world for acknowledged Covid19 deaths, closely followed by United Kingdom and Belgium. While Netherlands is showing well below Sweden and Belgium, ... <a title="Keith Rankin’s Chart Analysis – Covid19: Weekly Summary" class="read-more" href="https://eveningreport.nz/2020/05/15/keith-rankins-chart-analysis-covid19-weekly-summary/" aria-label="Read more about Keith Rankin’s Chart Analysis – Covid19: Weekly Summary">Read more</a>
CoveragePost
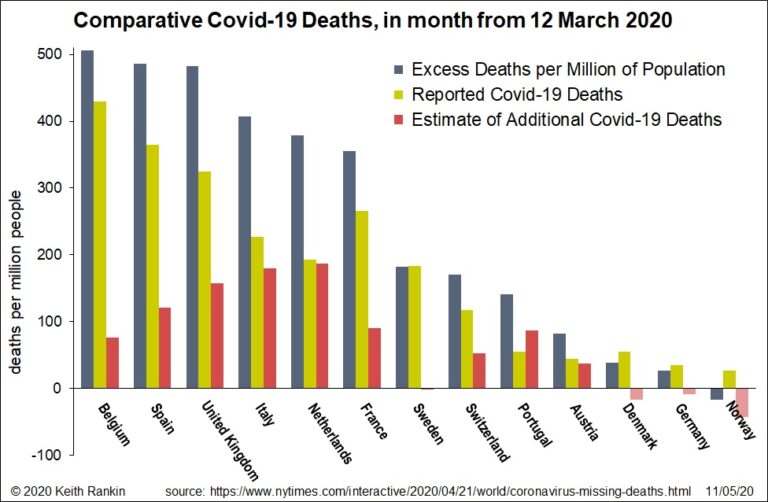
May 11, 2020
Analysis by Keith Rankin. Today’s chart shows (in grey) the estimated impact of Covid-19 on mortality rates in the selected countries. For most of these countries, the ‘excess death’ procedure provides an estimate of underreporting in underreporting countries compared to those with the most comprehensive reporting. Some of these extra deaths may have occurred as ... <a title="Keith Rankin Chart Analysis – Estimating the true death tolls from Covid19" class="read-more" href="https://eveningreport.nz/2020/05/11/keith-rankin-chart-analysis-estimating-the-true-death-tolls-from-covid19/" aria-label="Read more about Keith Rankin Chart Analysis – Estimating the true death tolls from Covid19">Read more</a>
CoveragePost
May 8, 2020
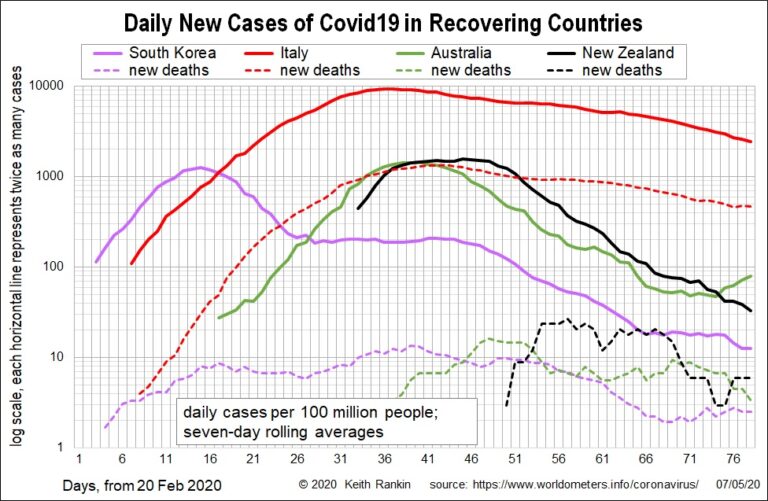
Analysis by Keith Rankin. This chart shows four recovering countries, including two of the first major outbreaks after China (South Korea and Italy), and the putative Australasian bubble. The chart shows daily average new cases, using seven-day rolling averages. Thus Italy is approaching 2000 new cases a day per 100 million people. Because Italy has ... <a title="Keith Rankin’s Chart Analysis – Covid19: Long Tail and Long Head" class="read-more" href="https://eveningreport.nz/2020/05/08/keith-rankins-chart-analysis-covid19-long-tail-and-long-head/" aria-label="Read more about Keith Rankin’s Chart Analysis – Covid19: Long Tail and Long Head">Read more</a>
CoveragePost
May 5, 2020
Analysis by Keith Rankin. Surviving the Black Flu It has been interesting for me to look back and investigate the Black Flu pandemic of 1918. The 1918 pandemic is widely regarded to have been the world’s worst pandemic since the Black Death of the late 1340s. (It was commonly known as the ‘Spanish Flu’, but this ... <a title="Keith Rankin Analysis – Smart Treatments in a Pandemic; Lessons from the Black Flu" class="read-more" href="https://eveningreport.nz/2020/05/05/keith-rankin-analysis-smart-treatments-in-a-pandemic-lessons-from-the-black-flu/" aria-label="Read more about Keith Rankin Analysis – Smart Treatments in a Pandemic; Lessons from the Black Flu">Read more</a>