Analysis by Keith Rankin.
Earlier this week, in The Truth about Prices in New Zealand, (on Evening Report, and on Scoop), I showed how the Consumers Price Index (CPI) is a lagging measure of inflation, and that the Producers Price Index (and the use of six-monthly rather than annual data) gives more timely information about turning points in inflation.
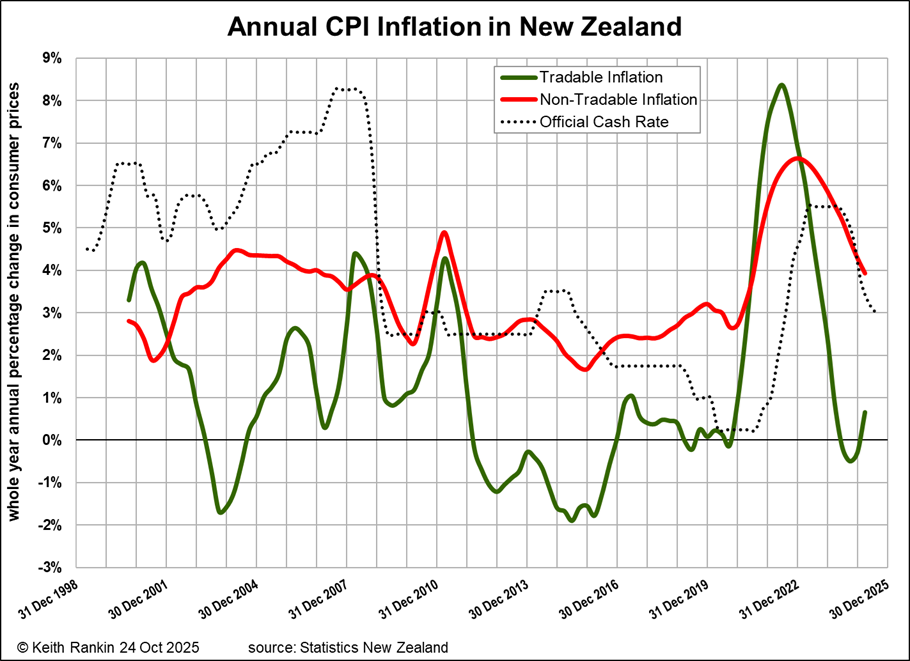
In this chart I look at the two published components of the CPI: inflation in the “tradable” and “non-tradable” sectors. And, because the CPI is a lagging measure, I have used the best presentation for historical reflection rather than for timely headlines. (This measure is annual, and it compares whole 12-month periods with each previous whole 12-month period. The latest data point in the chart matches to 31 March 2025, which is at the centre of the year-ending 30 September 2025.)
Consumer prices are retail prices, whereas producer prices are wholesale prices. Tradable CPI inflation mainly represents the retail prices of traded goods; goods New Zealand mainly exports and goods New Zealand mainly imports. Much of their pricing includes the markups of domestic retail outlets, domestic transport, and domestic customisation and packaging of imported manufactures and foodstuffs.
The non-tradable sector is mainly domestic services, utilities, and construction. Sellers of these services and goods do not compete with foreign suppliers.
In addition, the chart shows the monetary policy setting of the Official Cash [Interest] Rate; set by the Reserve Bank.
Interpretation
In the 2000s the OCR was set at what was then understood as normal levels, in the order of six percent. The received narrative of the time was that interest rates should be significantly above inflation rates. The achievement of such high real interest rates, then (and globally, not just in New Zealand), was probably the main single cause of the subsequent Global Financial Crisis in 2008. It created an environment in which money was transmitted en masse from borrowers to savers, and the ‘investor-class’ enjoyed ever-increasing demand for financial assets which would supercharge their ‘paper’ returns. In those years there was nothing like the degree of debt-phobia that exists today; leverage was the name of the game.
Despite the dubious anti-inflationary narrative which justified these high interest rate settings, high interest rates did not force countries’ domestic inflation rates towards the target rate of two percent. Due to globalised competition, the wholesale price inflation of traded goods remained low; even negative at times. In addition, for individual countries such as New Zealand, exchange rate appreciation also served to keep ‘tradable inflation’ very low. Indeed it was those high interest rates which facilitated the currency appreciations of ‘commodity currencies’ such as the New Zealand dollar.
Nevertheless, by the late 2000s, high ‘wealth effects’ – including (indeed especially) among indebted home owners – saw world commodity prices soar, leading to high inflation in the tradable sector despite commodity currency appreciations.
The Global Financial Crisis of 2008 and 2009 saw the collapse of a number of financial asset prices worldwide. Central banks cut interest rates dramatically, to revive a failing and flailing world economy. New Zealand’s annual inflation fell to below two percent. And it stayed below two percent for more than a decade. While non-tradable inflation sat between two and three percent, tradable inflation brought the overall CPI to one percent and even less (especially in 2015, ten years ago). (Note that the 2011 inflation ‘spike’ in New Zealand was due to the increase in the rate of Goods and Services Tax; GST.)
Interest rates in New Zealand were slashed to one percent in 2019, in the belief that that change would induce an upwards movement in the rate of inflation; and in the full knowledge that – if such monetary policy changes were to be effective – there would be a time lag of at least one year between the policy and the outcome.
Inflation did increase in 2021, though it would be foolish to attribute much of that to reductions in the OCR. Reductions on the OCR from 2015 had had minimal if any impact on inflation. And we know that 2021 and 2022 were very trying times indeed in the world’s supply chains, with pandemic and war. The supply chains quickly adjusted however.
Tradable inflation – even for a lagging measure such as the CPI – clearly turned downwards in 2022. And was plummeting in 2023. The steep rise in interest rates in 2022 could not have been the cause of the substantial tradable disinflation in retail prices; a falling inflation which began about the same time as the monetary policy squeeze.
Those increases in the Official Cash Rate almost certainly had an impact on non-tradable inflation, however. But not in a good way! Just as OCR settings between five and six percent in the early 2000s seem to have held non-tradable inflation at high above-target levels, so also do they seem to have held non-tradable prices in New Zealand in 2024 (and, based on recent quarterly data, continuing to have such an impact in 2025) at distress-inducing above-target levels.
The cost-of-living crisis since the National-led government took office is both the direct effect of the counterproductively high interest rates, and the laggard high non-tradables CPI-inflation which has extended well into 2025.
The real agenda for high interest rates would appear to be to recreate the early 2000s’ financial environment, whereby interest rates were well above inflation, and the elites of New Zealand and elsewhere were embarking on their ultimately destructive journey of inflating paper-wealth.
______________
Keith Rankin (keith at rankin dot nz), trained as an economic historian, is a retired lecturer in Economics and Statistics. He lives in Auckland, New Zealand.