Analysis by Keith Rankin.
One of the important indicators of a society’s living standards is the ability of its people to stay alive. Covid19 is seen as a problem mainly because, like the road toll, it represents a cause of death that has the potential to reduce that society’s life expectancy. Deaths averted may indeed represent a key performance indicator (KPI) for a government.
The objective exists in the context that all deaths are, by definition, a failure with respect to this KPI. In principle, all deaths are treated equally – deaths from one cause are no less tragic than deaths from another cause. Deaths averted treat all causes of death equally, and all ages of death equally. Yet this KPI is somewhat artificial. Everyone must die sometime, deaths of young people represent more years of life lost; and most of us think that some deaths are more horrible than others.
New Zealand is a country, more than most, with rising annual deaths. This is mainly because New Zealand has more rapid population growth than most economically developed countries, and because older people are becoming a bigger proportion of that rising population.
Actual deaths
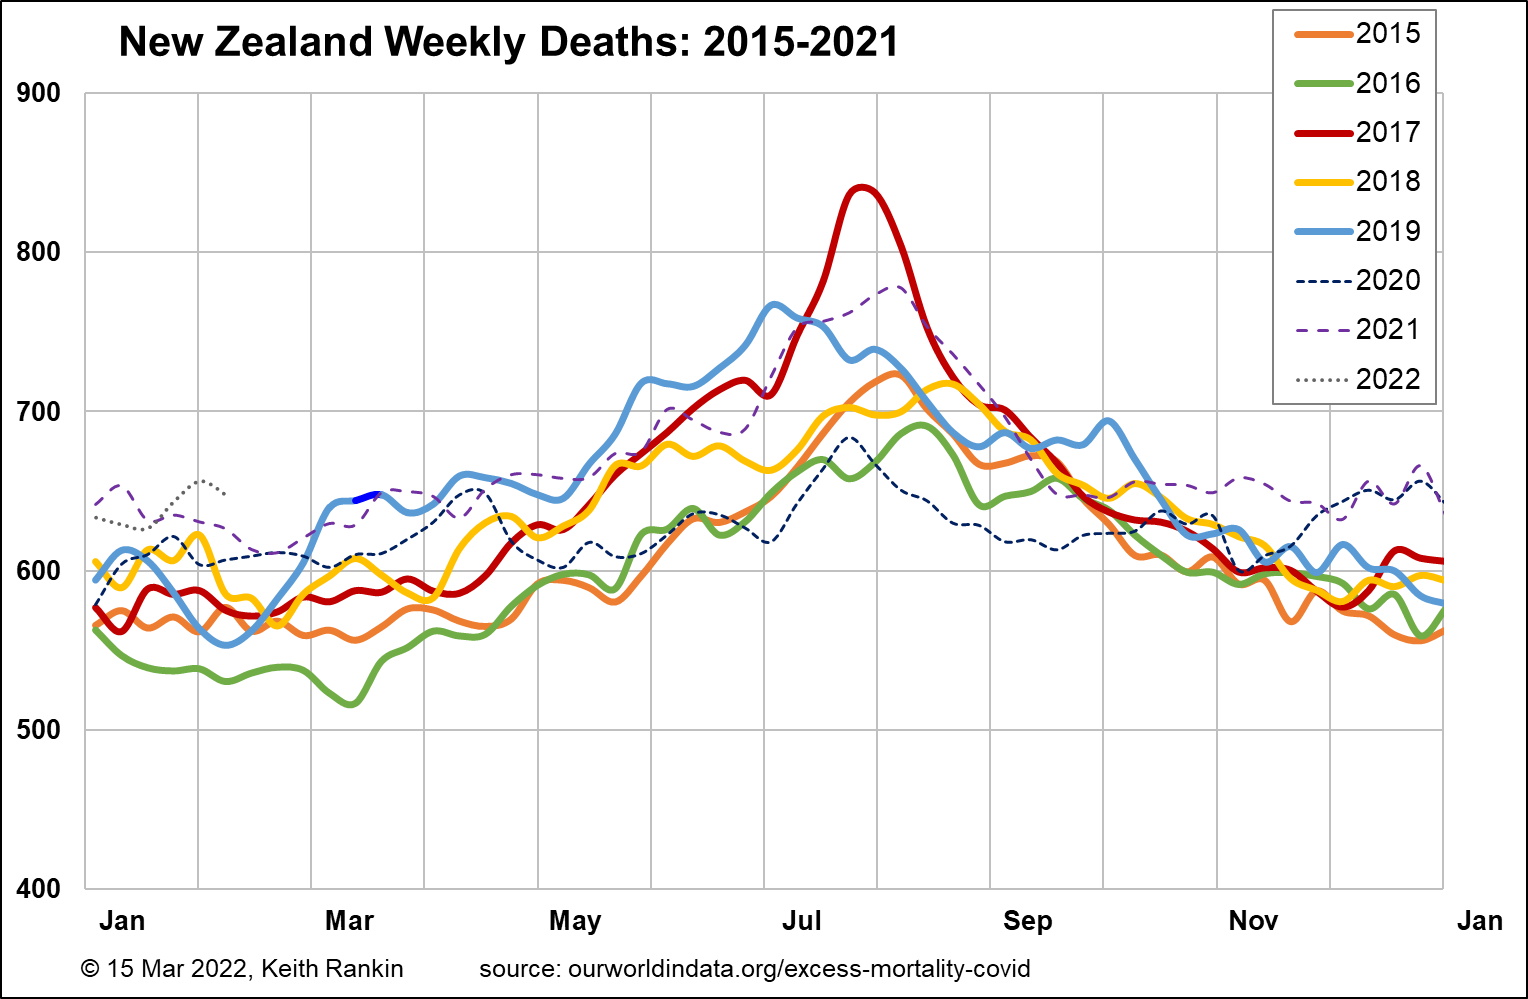
The first chart shows weekly deaths in New Zealand for each year from 2015. The first thing most people will notice is the winter peak, and in particular how large that peak was in 2017. (This was in fact an influenza pandemic – much worse than the 2009 pandemic – though it was never labelled a pandemic by the World Health Organisation.) In general, this chart tells us that ‘winter infections’ contribute significantly to deaths in New Zealand.
The second main feature of the chart is that the general tendency is for deaths to be higher in more recent years. This is, as already noted, exactly what would be expected in a country with both a rising and an aging population. Having noted this, we can also say that 2016, 2018, and 2020 were good years on the mortality front.
Two more points to note. The impact of the Christchurch mosque tragedies (three years ago today) is shown, in dark blue, as an upward blip in mid-March of 2019. And the winter peak in 2021 looks rather high, given that there were very few deaths that winter from either coronaviruses or influenza.
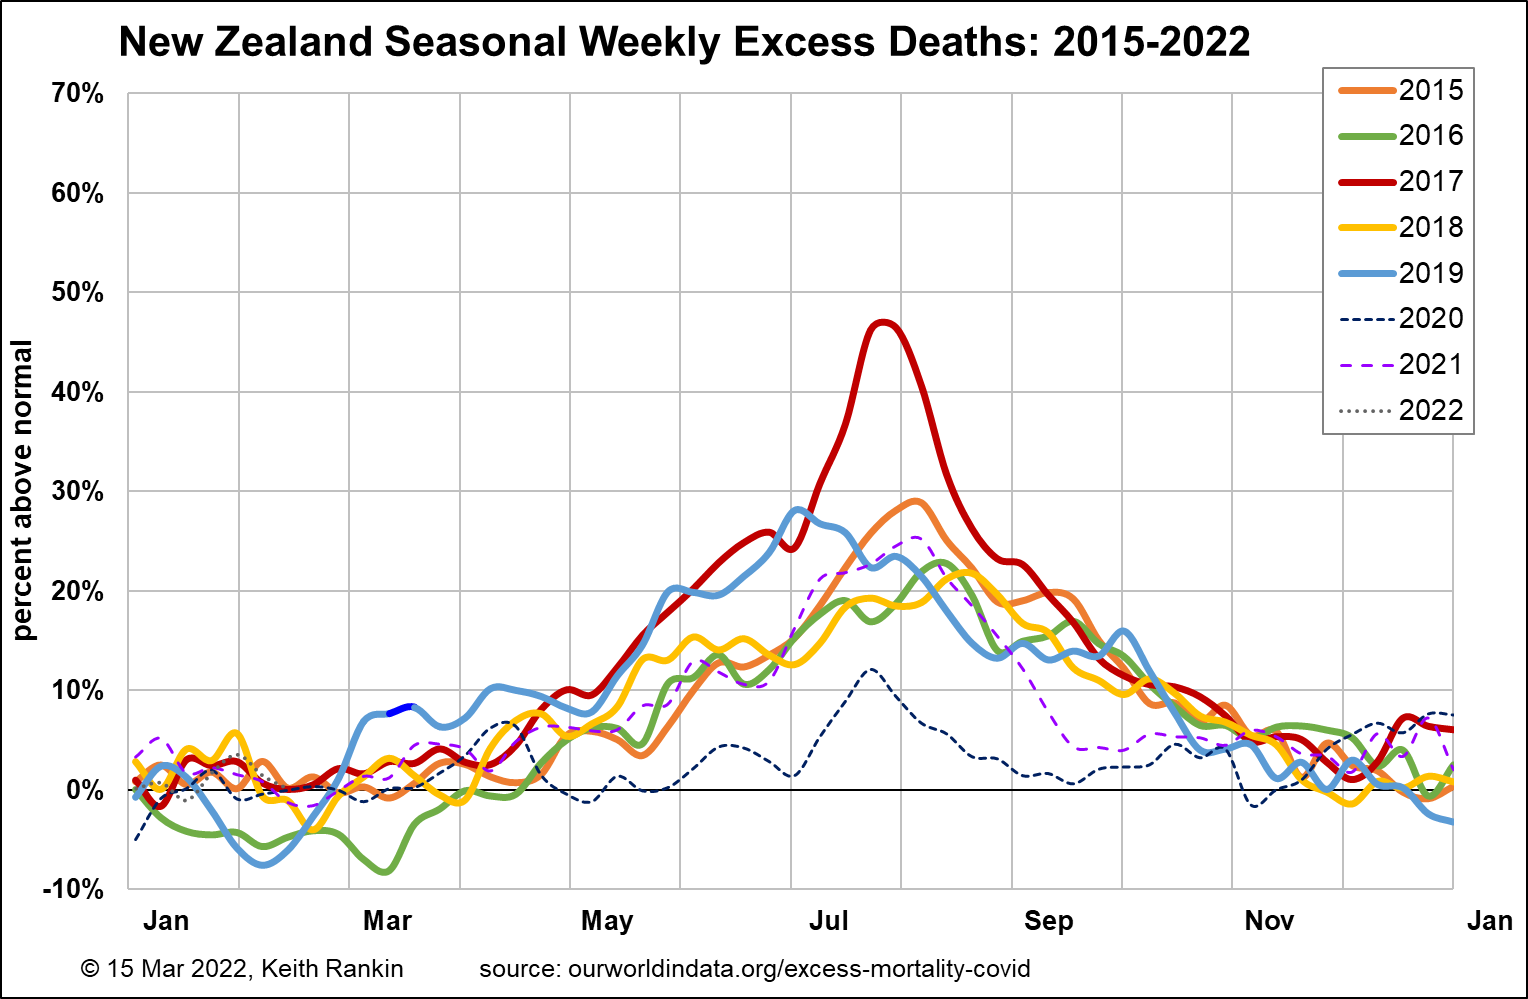
The second chart estimates baseline ‘normal’ for each year (meaning deaths not resulting from seasonal or one-off factors), and then shows ‘excess deaths’ relative to that norm. Thus, both seasonal and one-off death events will show. The normal demographic rise in death numbers is corrected for (so does not show).
While all years show seasonal mortality peaks in winter, 2020 has easily the smallest peak, mainly due to Covid19 pandemic public health measures largely keeping out colds and influenzas. The main direct impact on deaths of the lockdowns shows as low deaths in May and September 2020, as well as a generally lower winter death toll that year.
2021 was surprisingly normal; no impact in New Zealand of Covid19, nor much impact of the ‘delta’ lockdown (except that delta-covid itself had no discernible influence on mortality, thanks to the lockdowns). The winter mortality peak in 2021 is a matter of concern, though; a matter that needs further explanation from our small community of expert epidemiologists.
So far, 2022 is looking completely normal. Omicron-covid will probably see March 2022 looking much like March 2019.
Excess Death by Age
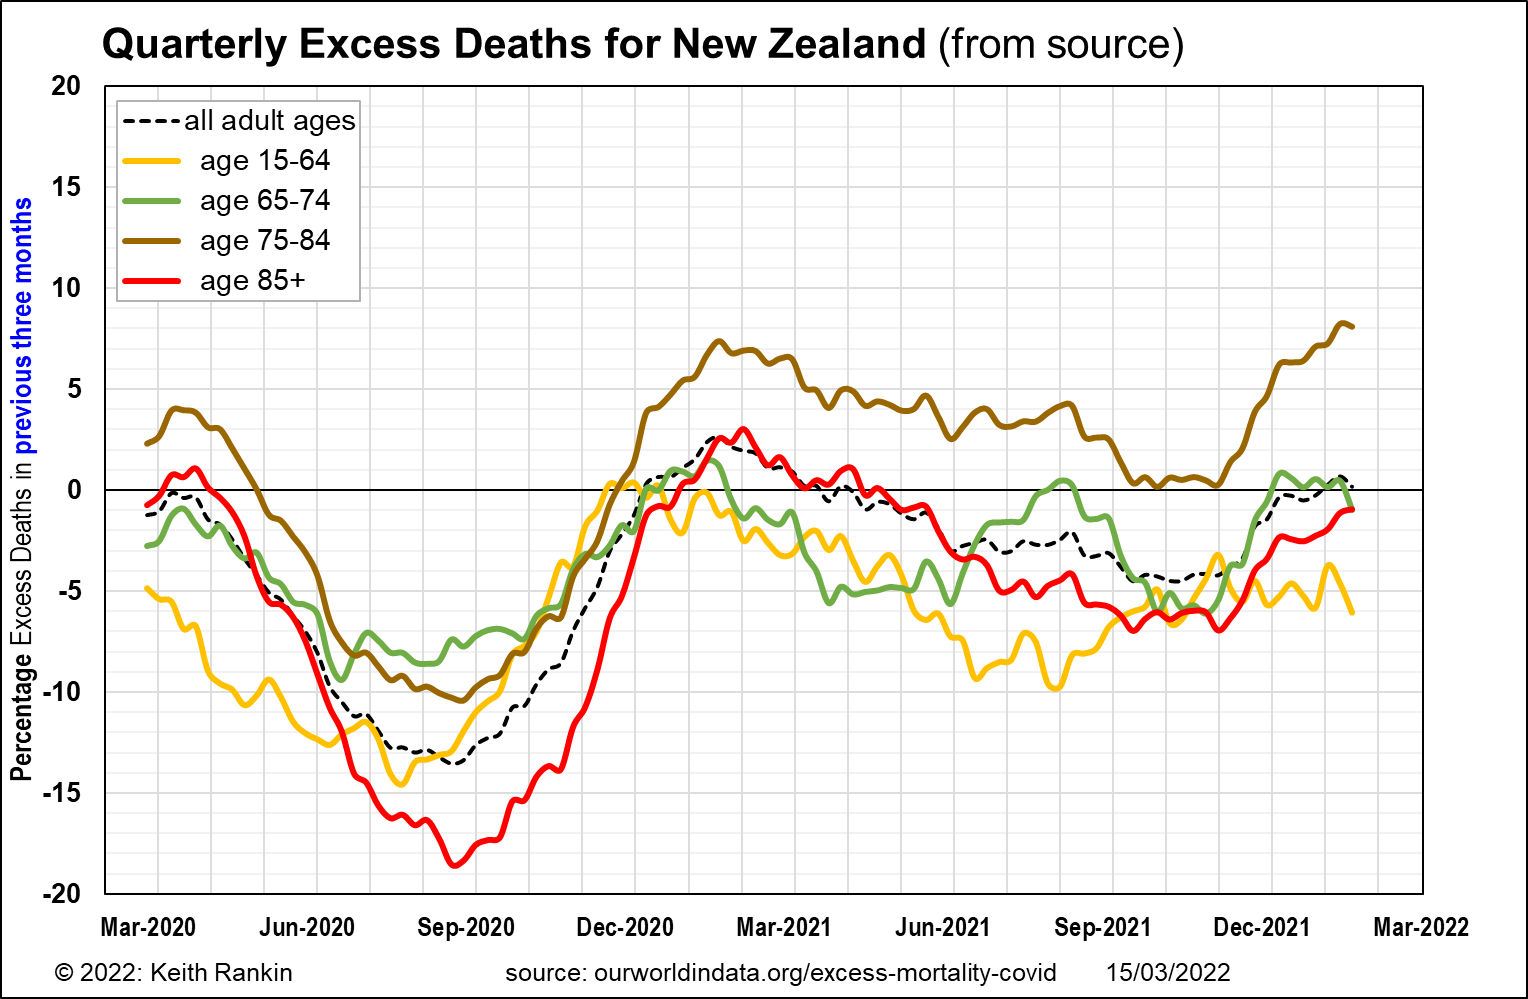
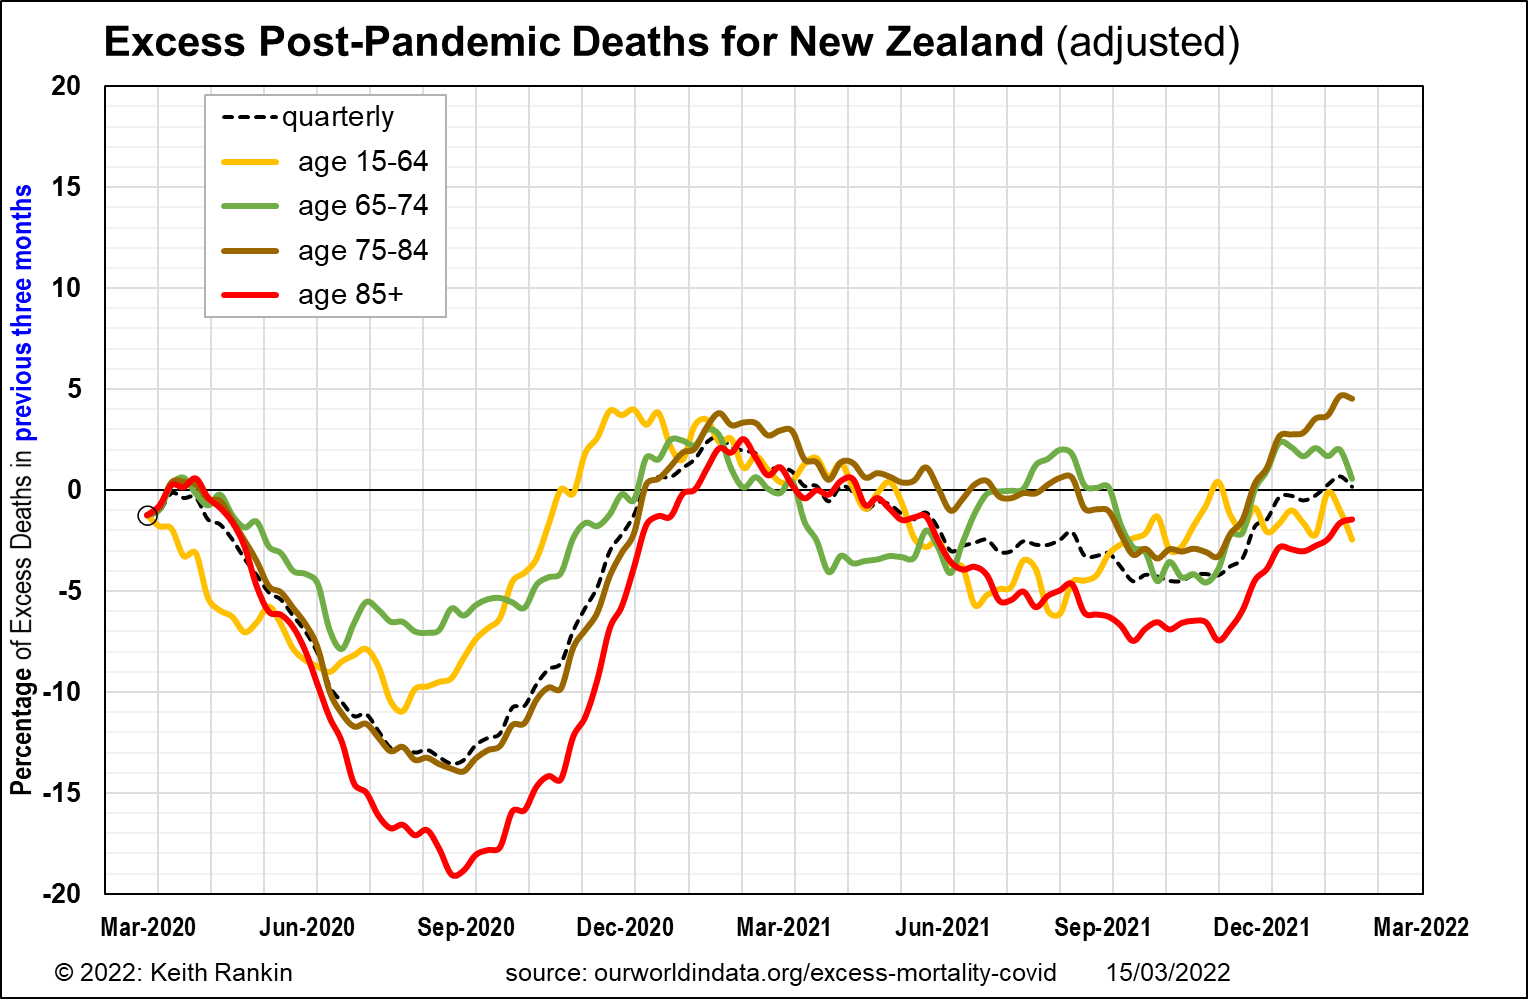
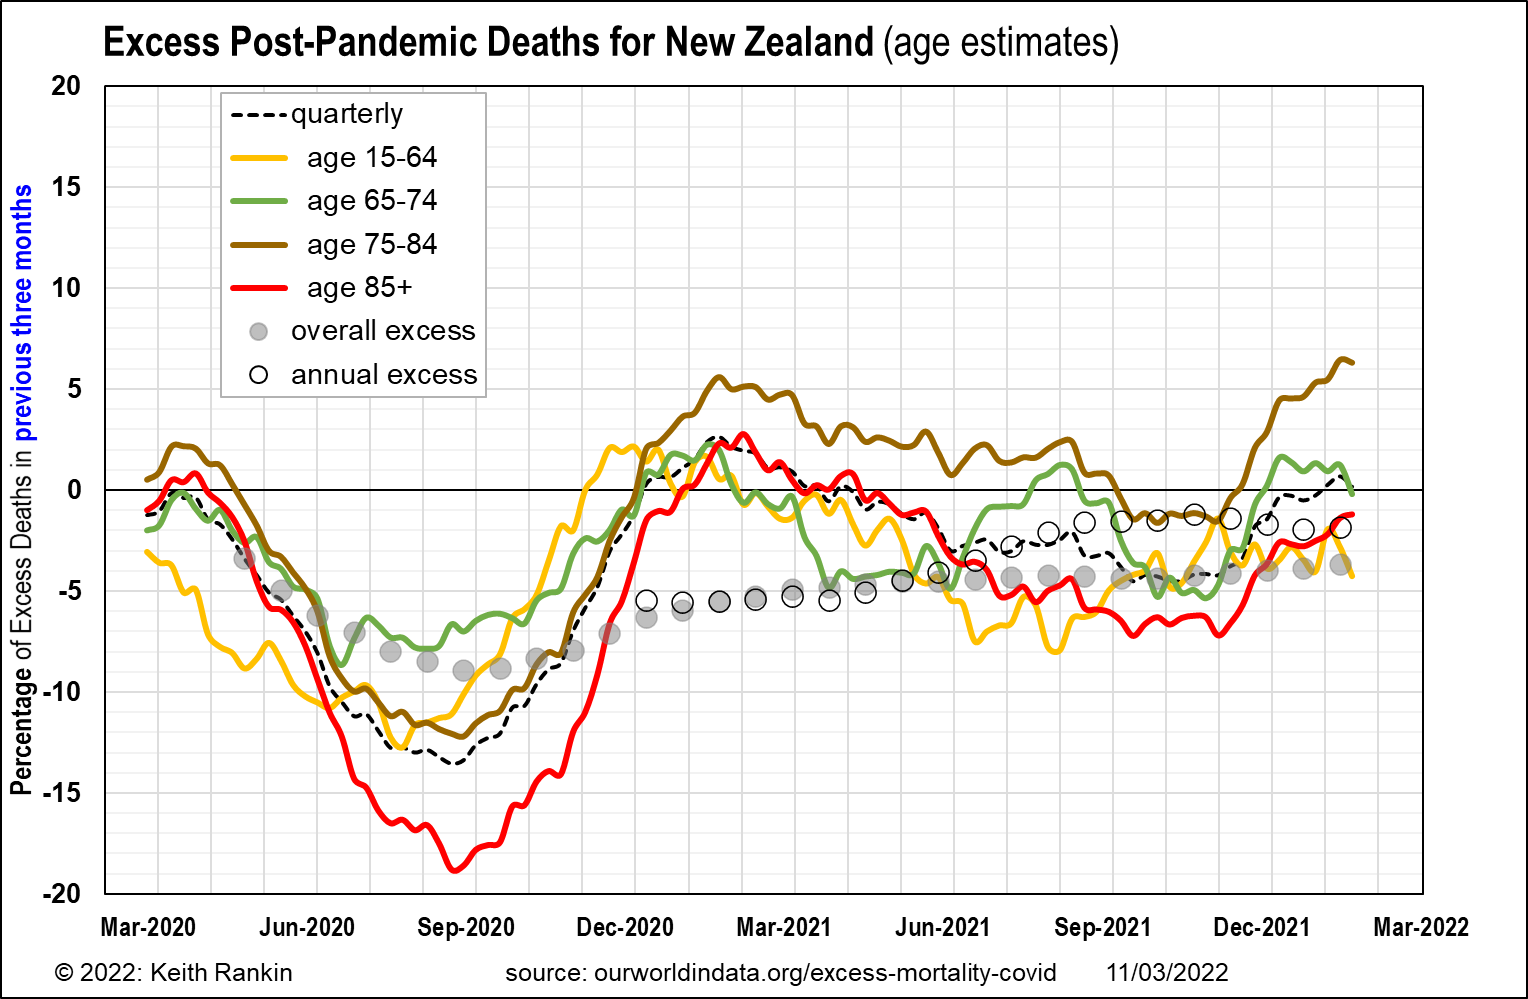
These three charts use ‘excess death’ estimates published by ourworldindata.org. I have been unable to locate the raw data used to calculated ‘projected deaths’ for each age group. ‘Excess deaths’, for each age group, is actual deaths minus projected deaths, calculated as a percentage of projected deaths.
In the first chart, we see that, in the first quarter of 2020, there were excess deaths of people aged 75 to 84; but an apparent shortfall for other age groups, especially working-age adults (15-64). It is likely that some of these differences are random, though we also know that there will be more deaths of people aged 75-84, because there are now many more New Zealanders in that age group. It is therefore surprising how few deaths there were, in 2020 pre-covid, of people aged 65-74.
The second chart adjusts these estimates to put all age groups on an equal footing at the beginning of the pandemic. It suggests a dramatic fall in deaths of older New Zealanders, compared to what would have been had there been no Covid19 modifications to New Zealanders way of life.
In the final chart, I simply average the previous two charts, giving a more robust estimate of excess deaths. It looks as though people aged 75 to 84 have died in slightly larger numbers in 2021 and 2022 than would have been expected had normal times prevailed until 2022. People in that age group who avoided death triggered by colds or influenza in 2020 may have died in 2021 from underlying conditions, and perhaps in some cases from treatment delays.
In addition, there are signs that the other older age groups may be dying in slightly larger numbers this summer than would have been expected given the public health mandates.
Finally, this last chart shows the overall mortality ‘excess’, which has been negative through out the pandemic period. Thus, lives have been saved. It does not mean that lives will continue to be saved. Indeed, we see that the annual excess of deaths in New Zealand to October 2021 was close to zero. My prediction is that in the year to October 2022, excess deaths in New Zealand will be significantly above zero, even if the Russian conflict has not by then brought about World War Three.
A word of caution. Until January 2022, Hong Kong – with similar covid policies to New Zealand – will have had a similar profile of excess deaths to New Zealand. That is certainly not the case in February and March. In the last week, Hong Kong’s recorded Covid19 death toll has been five times worse (per capita) than the next worst country (Brunei, which has a similar story to Hong Kong).
*******
Keith Rankin (keith at rankin dot nz), trained as an economic historian, is a retired lecturer in Economics and Statistics. He lives in Auckland, New Zealand.


