Analysis by Keith Rankin.

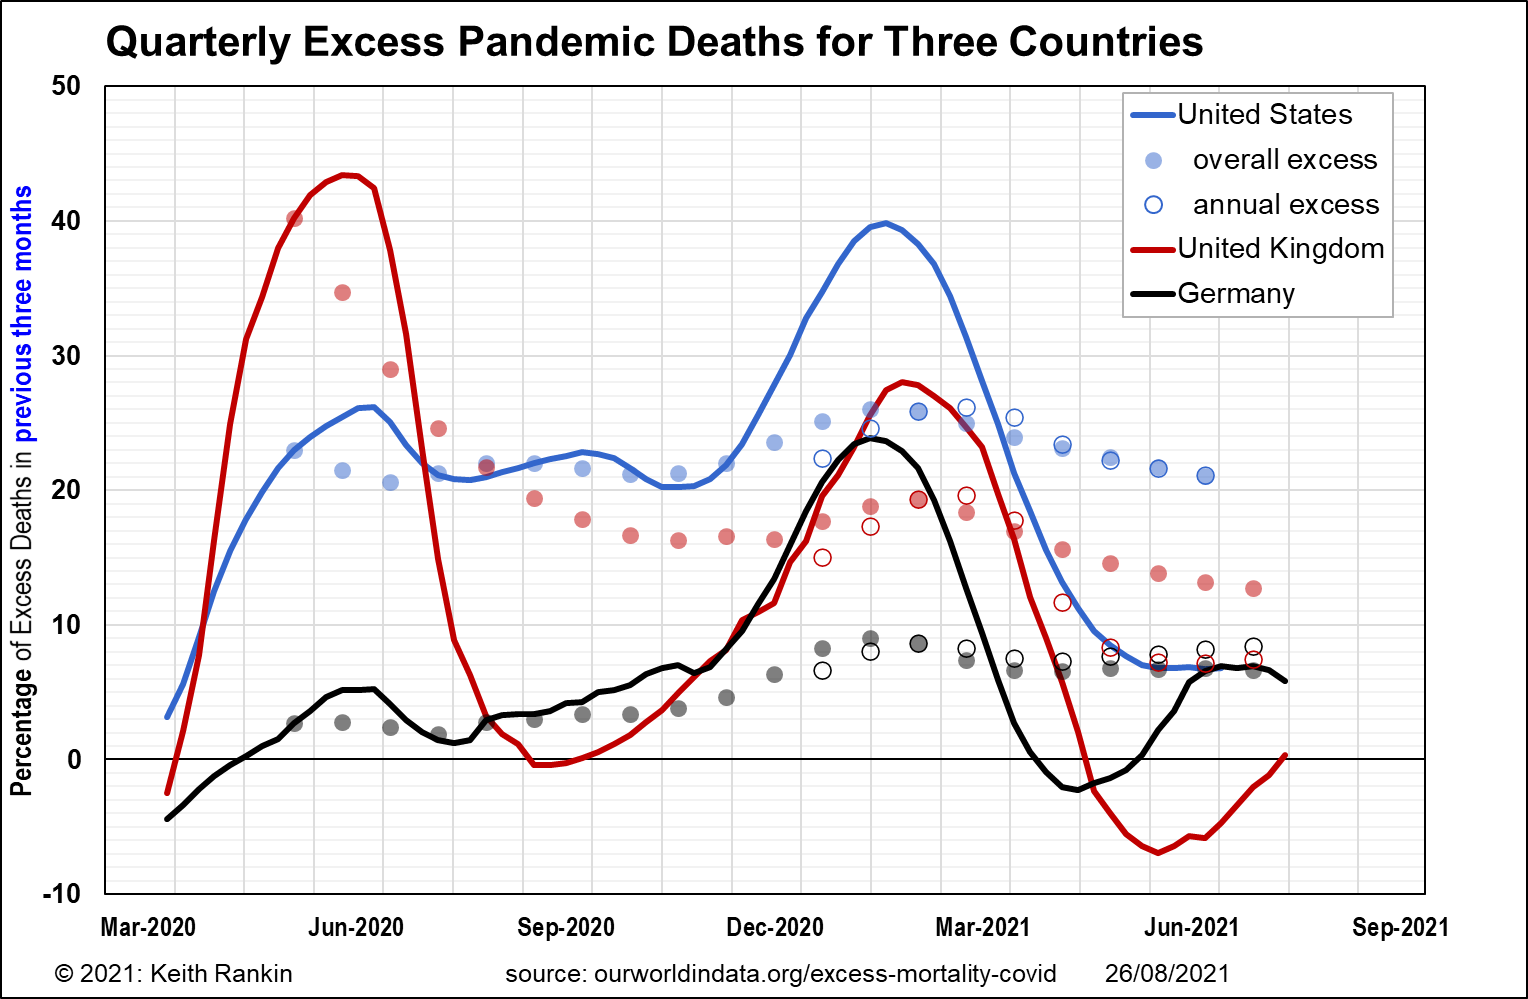
The first chart shows the three largest western countries: United States, United Kingdom, and Germany. The solid line plots represent quarterly average rates of excess death. It is clear that the United Kingdom copped Covid19 very early and very hard. The mid-June peak represents the period from mid-March to mid-June. It is important, however, to acknowledge the rapid fall in British deaths, after that peak. The United States had a much lower peak, and, for that same period, Germany hardly registers. The main issue here was the different abilities to protect the population aged over 80 from the ravages of the pandemic.
For Europe’s second wave, which represented the United States’ third wave, Germany was nearly as badly affected as United Kingdom; and slightly earlier, reflecting the continental European event that was most likely caused by late-summer tourism from the United States. (The later second peak in the United Kingdom reflects the Christmas New Year holidays; likewise, the United States whose peak was slightly earlier due to thanksgiving.)
The impact of the Delta variant barely shows on this chart, though we should note that Delta became predominant in the United Kingdom by 1 June (75% of cases), and by 1 July (just over 50% of cases) for Germany and the United States. The United Kingdom has lower deaths than the others in the most recent mortality data, probably due to more vaccinations, and despite rather than because of Delta.
The filled dots represent overall excess deaths, commencing with 24 May 2020, based on an assumption that the pandemic (outside of China) started to register in the death statistics from around 24 February 2020. And the unfilled dots represent annual average excess deaths; the first unfilled blue dot represents average excess mortality in the United States from mid-January 2020 to mid-January 2021.
We see that annual pandemic excess mortality is easily highest in the United States, due to its prolonged period of high Covid19 infection and death.
While overall excess deaths remain higher in United Kingdom than Germany, we see that annual excess deaths are now lower in the United Kingdom than Germany. Indeed Germany’s 2021 Covid19 outbreak, which roughly coincides in time with India’s big outbreak, is considerably more fatal than Germany’s first wave a year earlier. Germany’s 2020 outbreak – as shown through available excess death data – is too soon to be indicative of Delta.

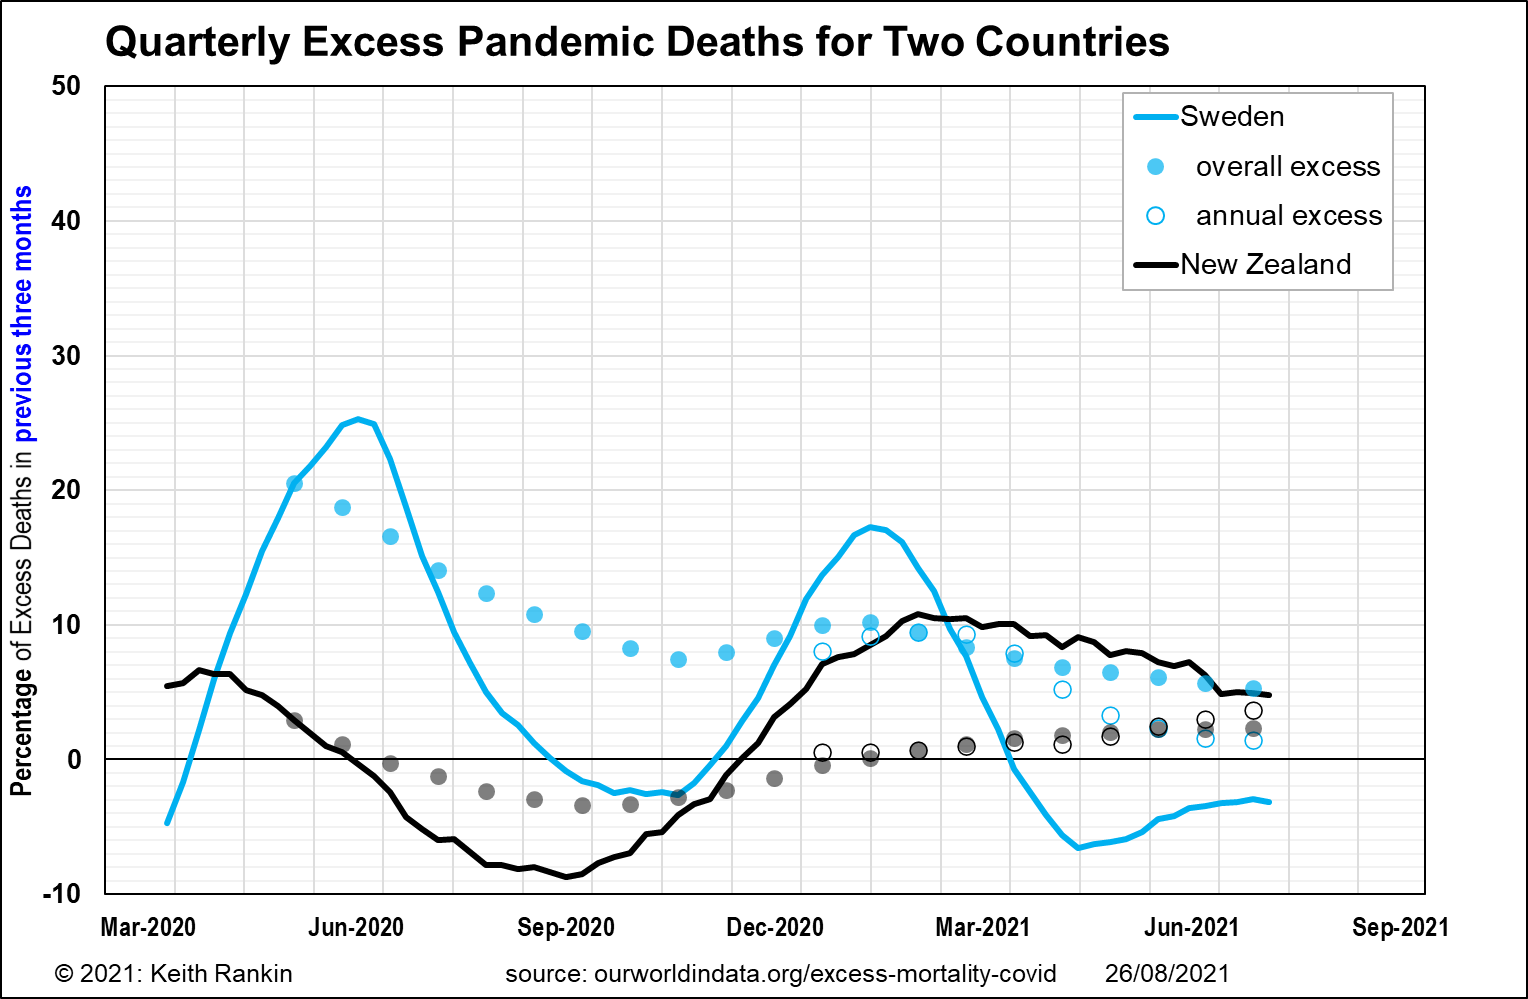
The second chart, of the same type, shows Sweden and New Zealand. It uses the same scale as the previous chart. The timing of Sweden’s first peak is the same as that for the United Kingdom, though deaths in Sweden were fewer, more confined to the oldest age group. Covid19 had no direct impact on excess deaths in New Zealand. Sweden’s second peak, while lower than Germany’s, was identically timed. It would appear to be derivative from the wave of covid cases that first appeared in Europe’s prime tourist destinations around August 2020.
While Sweden continues to have more excess deaths than New Zealand over the whole pandemic period, this has not been true for annual excess deaths for the year to the end of June 2021. Projecting these data forward, it is quite plausible that Sweden’s overall pandemic-period mortality impact may prove to be less than New Zealand’s by December 2022.
Some of New Zealand’s excess deaths may be indirectly related to Covid19. We might also note that New Zealand has some unusual demographics which may be showing an overstatement of excess deaths. Sweden, on the other hand, a neutral country in World War Two, almost certainly shows a more conventional population pyramid, at least for people aged over 60.
New Zealand and Sweden represent opposite ends of the policy spectrum, when it comes to addressing Covid19. The ideal policy is probably to take the best of both country’s approaches. There is no doubt that Sweden’s initial strongly non-interventionist approach was a failure; in particular in its initial refusal to test for Covid19 except for people already hospitalised, and in its unwillingness to at least have a ‘circuit-breaker lockdown’. However Sweden paid much more attention to the need to have a well-immunised population, with immunisation coming from a mix of natural and artificial (ie vaccination) means. Sweden, with much higher vaccination rates than New Zealand, falls considerably short of United Kingdom vaccination levels.

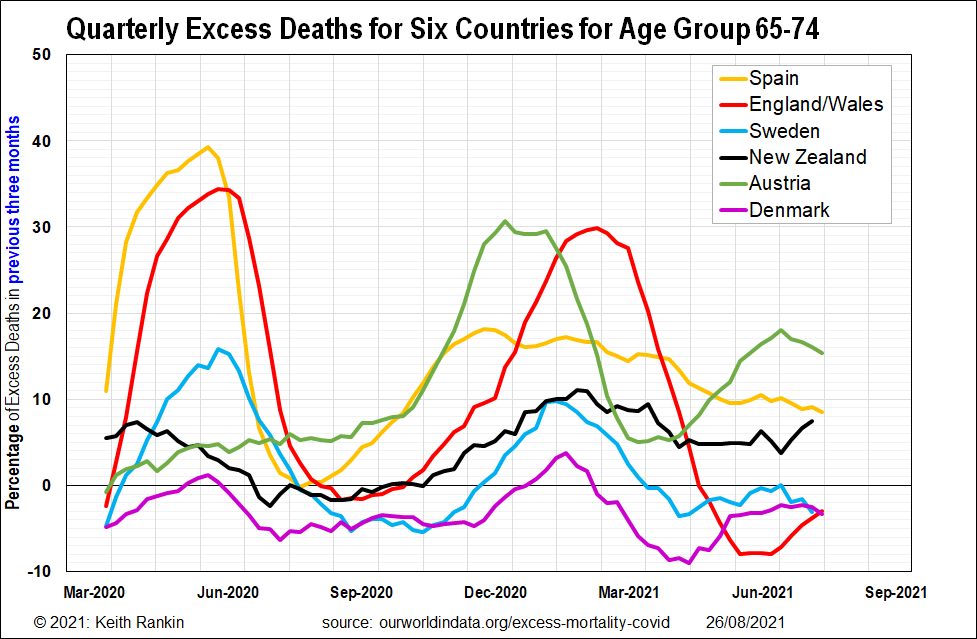
The final chart shows quarterly excess mortality for people aged 65-to-74 (my age group) for six countries, including New Zealand. In principle this age group catches a mix of those who are older and hence more vulnerable and those who mix and mingle in the community. This is the classic ‘boomer’ age group. For the countries given, New Zealand has the third highest boomer excess mortality, after Spain and Austria. We note that Austria was affected by the same early summer third wave of Covid19 that affected Germany. And we note that Spain, while never coming close to its original peak mortality, has been largely living with Covid19 ever since then.
Two of the other three countries – Sweden and Denmark – have had consistently negative excess mortality for the boomer age group in 2021. Further, for this age group, excess mortality has been higher in New Zealand than in Sweden for the last twelve months. While New Zealand may have a faster growing age 65-74 cohort than Sweden, Sweden has a considerably lower base mortality for this age cohort (ie Sweden has a higher life expectancy than New Zealand). So, the two sources of possible bias in the data somewhat cancel out. Denmark, which had a bigger per capita caseload than Sweden in their second covid waves, has consistently lower excess mortality for 65-74 year-olds than either New Zealand or Sweden. And Denmark was more adversely affected by World War Two than was Sweden. Denmark’s demographic idiosyncrasies for births in the years 1940 to 1955 are likely to be few; or at least something of an average between Sweden’s and New Zealand’s.
Finally, the United Kingdom, the only one of the six countries whose shown Covid19 death rates could have been influenced by Delta, had the lowest incidence of boomer deaths in the three months to mid-July 2021. This most likely reflects the prolonged (albeit easing) England lockdown, and will probably not be sustained. (I am guessing that we will see quarterly excess deaths in England hover at around plus five percent for the remainder of the year.)
______________
Keith Rankin, trained as an economic historian, is a retired lecturer in Economics and Statistics. He lives in Auckland, New Zealand.
contact: keith at rankin dot nz


