Analysis by Keith Rankin.
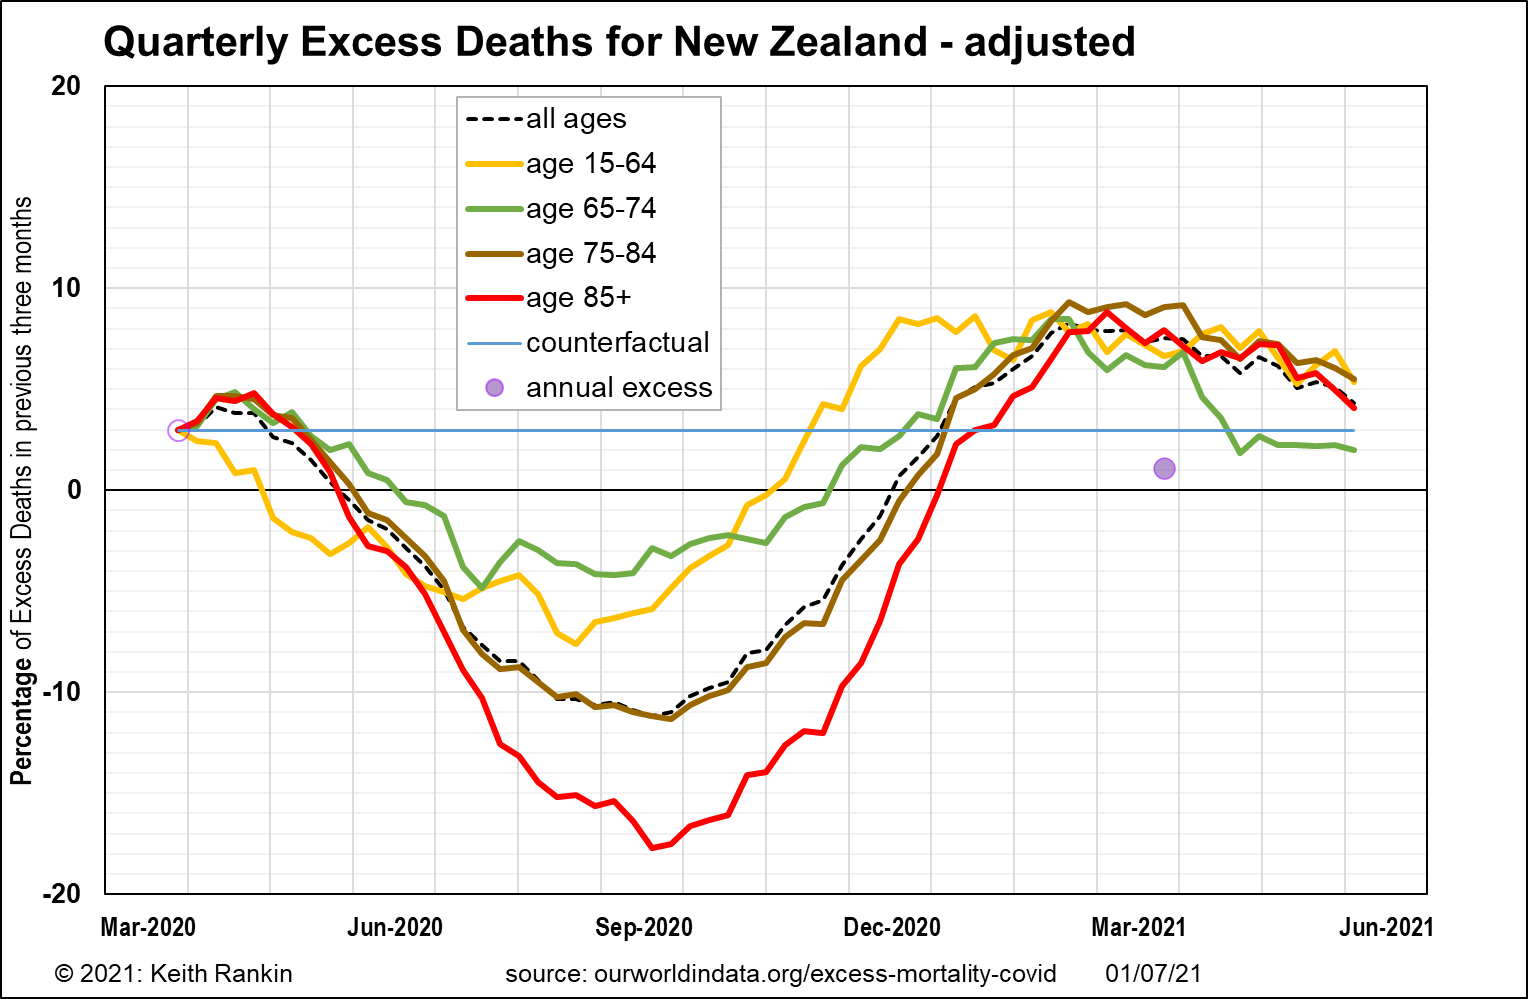
On 21 June 2021 I published this chart, showing high levels of excess deaths in Aotearoa, for all age groups. However, the source data provide a somewhat crude measure of excess deaths. The measure may be distorted by demographic changes; the rate of population growth, and changes to the age distribution of a country’s population. The data also represents excess deaths arising from falling living standards. (Or, where excess deaths in the beginning of 2020 are negative, rising living standards.)
Adjusting such crude data can be a laborious process, the importance of which is often not acknowledged. Here, because I want to compare different countries for which data is available on ourworldindata.org/excess-mortality-covid, I have to make some general assumptions that can be applied the same to each country.
First, I have averaged excess deaths for the first 10 weeks of 2020. Second, I have attributed half of this pre-covid excess (whether positive or negative) to demographic change, and half to changes to a country’s living standards.
Second, I have considered each age group to have been equally subject to changes in a country’s standard of living.
The result is that each country shown has a ‘counterfactual’ baseline, showing estimated changes in mortality arising from changes in living standards since 2017 (where 2017 represents the midyear of the second half of the 2010s’ decade). Excess deaths due to Covid19, or to Covid19’s wider epidemiology, exist where chart values are above the counterfactual baseline. Deaths averted as a result of Covid19 restrictions – and changing behaviours arising from these – are shown by chart values below the counterfactual baseline.
The purple ‘dot’ at the end of March 2021 shows the annual average impact of the Covid19 pandemic on New Zealand’s mortality. It is below the counterfactual baseline, suggesting that deaths in the year to March 2021 are a little less than would have been the case had the pandemic not occurred.
New Zealand data suggests a three percent rise in mortality (corrected for demographics) for January and February 2020 compared to three years earlier. This represents a significant fall in New Zealanders’ living standards; a fall completely unrelated to Covid19.
For the remainder of 2020, death rates fell for all age groups, mainly I would presume because of the general absence of influenza.
2021 is a very different story, however. There are significant numbers of additional deaths, many of which may be classed as ‘postponed’ deaths arising from Covid19 restrictions. (Note that we have been hearing, but not responding to, a number of red flag stories such as this one. “The South Auckland hospital is hit by a huge winter spike in sick children”; I understand it’s not only children, and not only south Auckland. The story mentioned a general rise in “respiratory infections” in Aotearoa; so no Covid19 this year, but no shortage of covid-like trouble.)
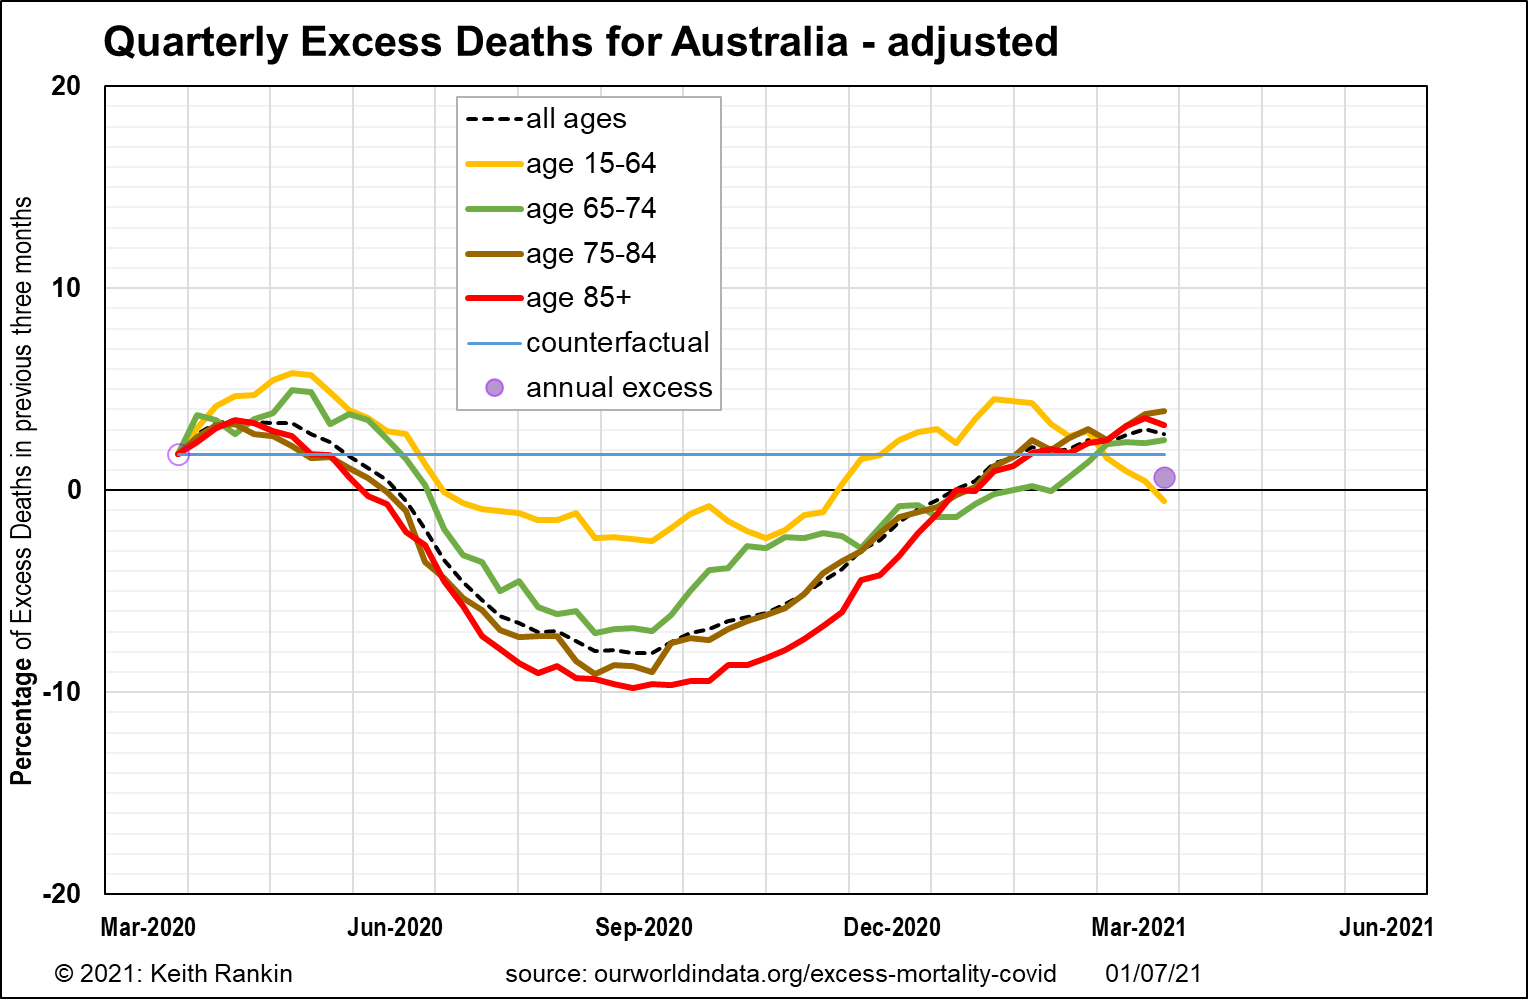
Australia shows a similar pattern to New Zealand, though less dramatic. It is possible that an individual state in Australia would be closer to New Zealand, though I do not know which one. The main difference is that Australia had more deaths in early 2020 that appear to be covid-related, but could not be. Possibly stresses and strains arising from the that terrible bushfire summer took their toll; maybe smoke inhalation exacerbated pre-existing respiratory conditions. The other difference is that the pattern is New Zealand of excess excess-deaths in early 2021 is only minimally replicated.
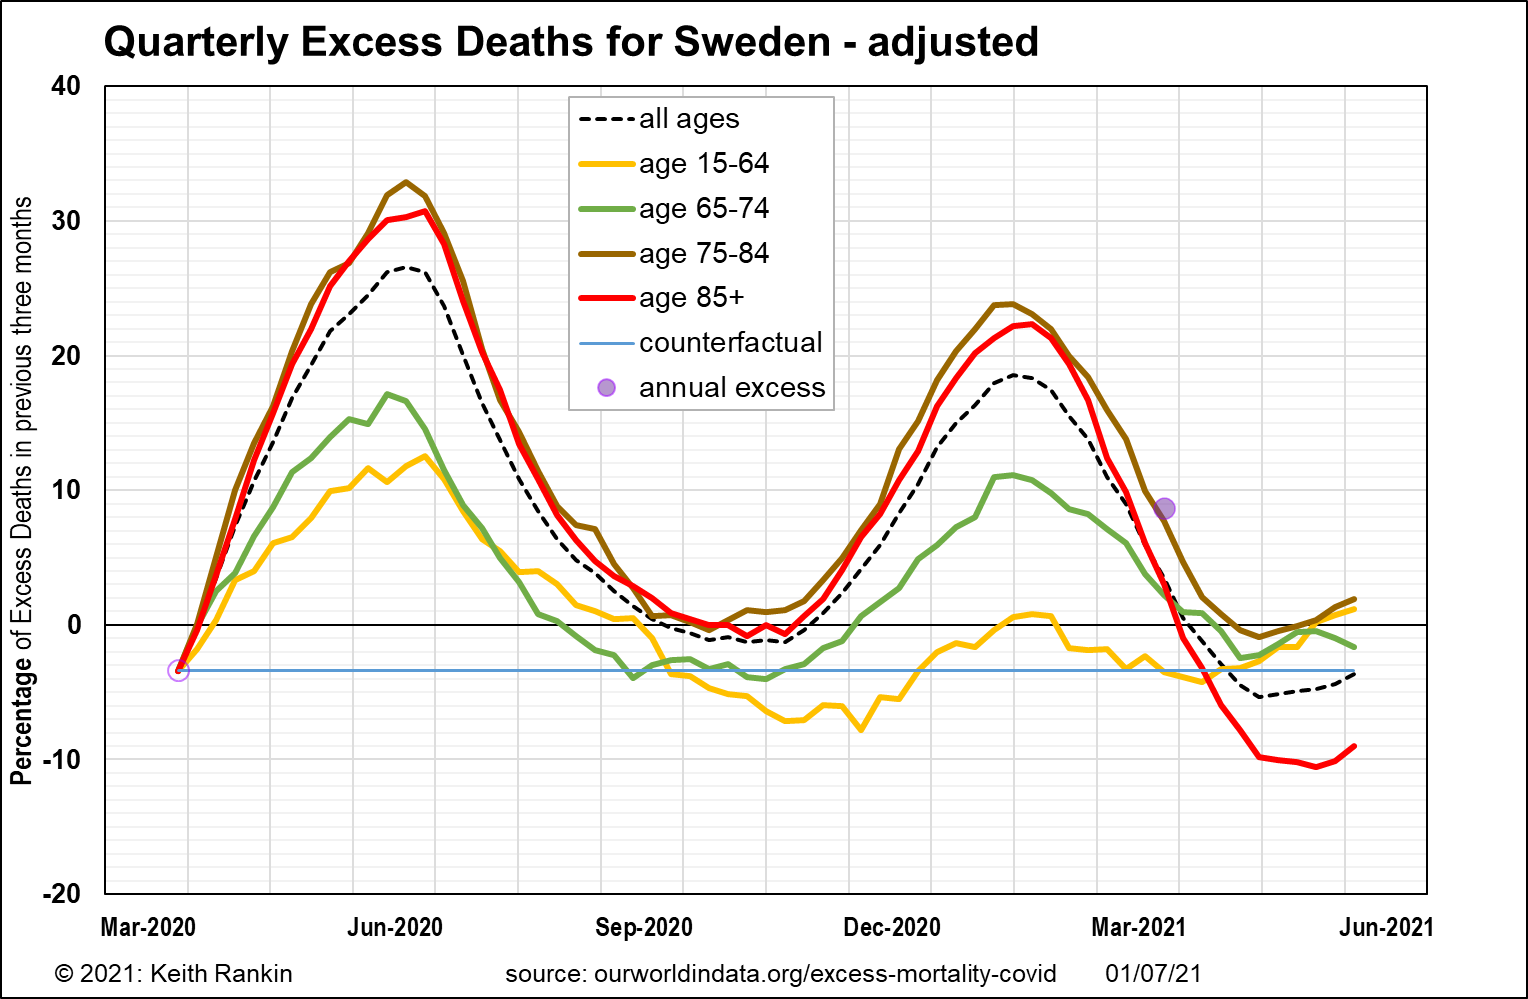
Sweden, in June 2020, had the world’s worst official Covid19 death statistics. Certainly older Swedes ‘took one for the team’ (the team of ten million). Sweden’s early 2020 mortality rates indicate that its living standards were rising, unlike New Zealand and Australia. In 2021, Sweden has had no excess deaths, though, relative to Sweden’s covid counterfactual, Covid19 continues to have some impact on Sweden’s mortality.
Overall, in the year to March 2021, Sweden had excess deaths at 8.5% (and covid-related excess deaths at 12% for the year). This compares to 1% and -2% for New Zealand. New Zealand’s recent problem is non-covid excess deaths, though the New Zealand health authorities and mainstream media appear to be very relaxed about this.
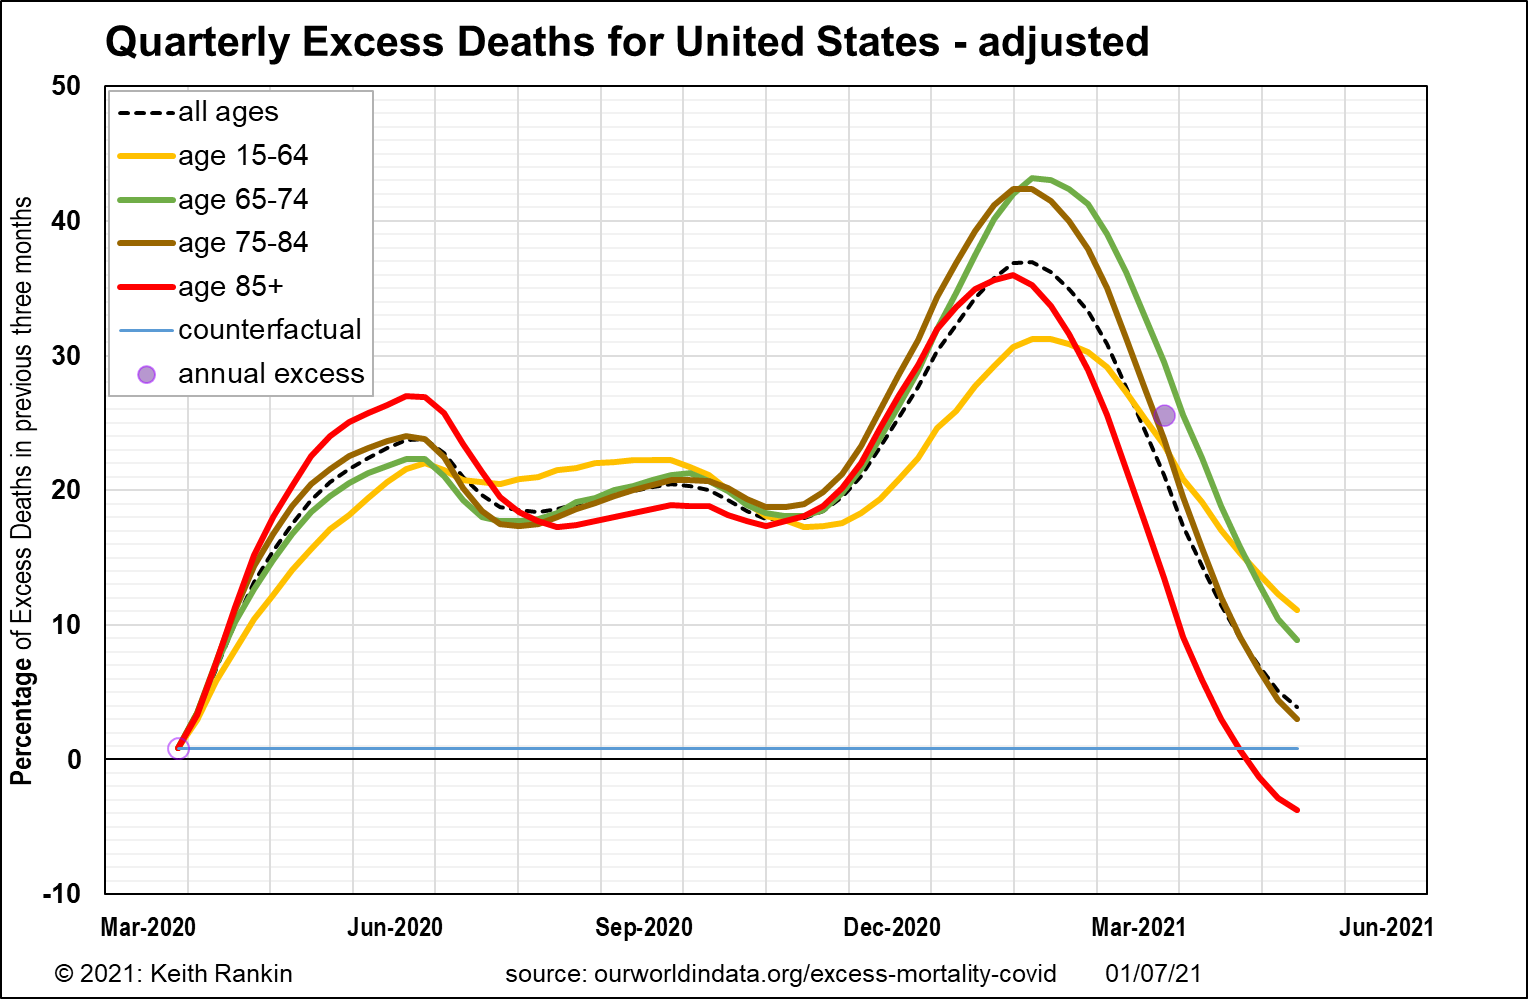
Like New Zealand and Australia, USA has had pre-covid excess deaths, suggesting falling living standards had already set in early in 2020. By March 2021, United States had 25.5% excess deaths, almost all of which were directly or indirectly due to Covid19. This is well in excess of Sweden’s covid toll.
The bigger surprise is that younger people fared as badly as older people, at least in proportion to normal death rates for their age cohorts. Further, in the US spring of 2021, it is the younger age groups who continue to be dying at 10% above pre-covid expectations. This means that huge numbers of American travellers (many without symptoms) had Covid19, and took it with them.
Of important interest is the role of younger people in perpetuating the pandemic in the northern summer of 2020. My analysis of Europe’s covid resurgence in the northern autumn, is that it was American tourists who brought Covid19 back to Europe in July and August. And, in terms of America’s political divide, almost certainly these American vectors of Covid19 were mostly ‘liberals’; Trump opponents rather than Trump supporters. This was almost certainly accentuated by Americans travelling to Israel.
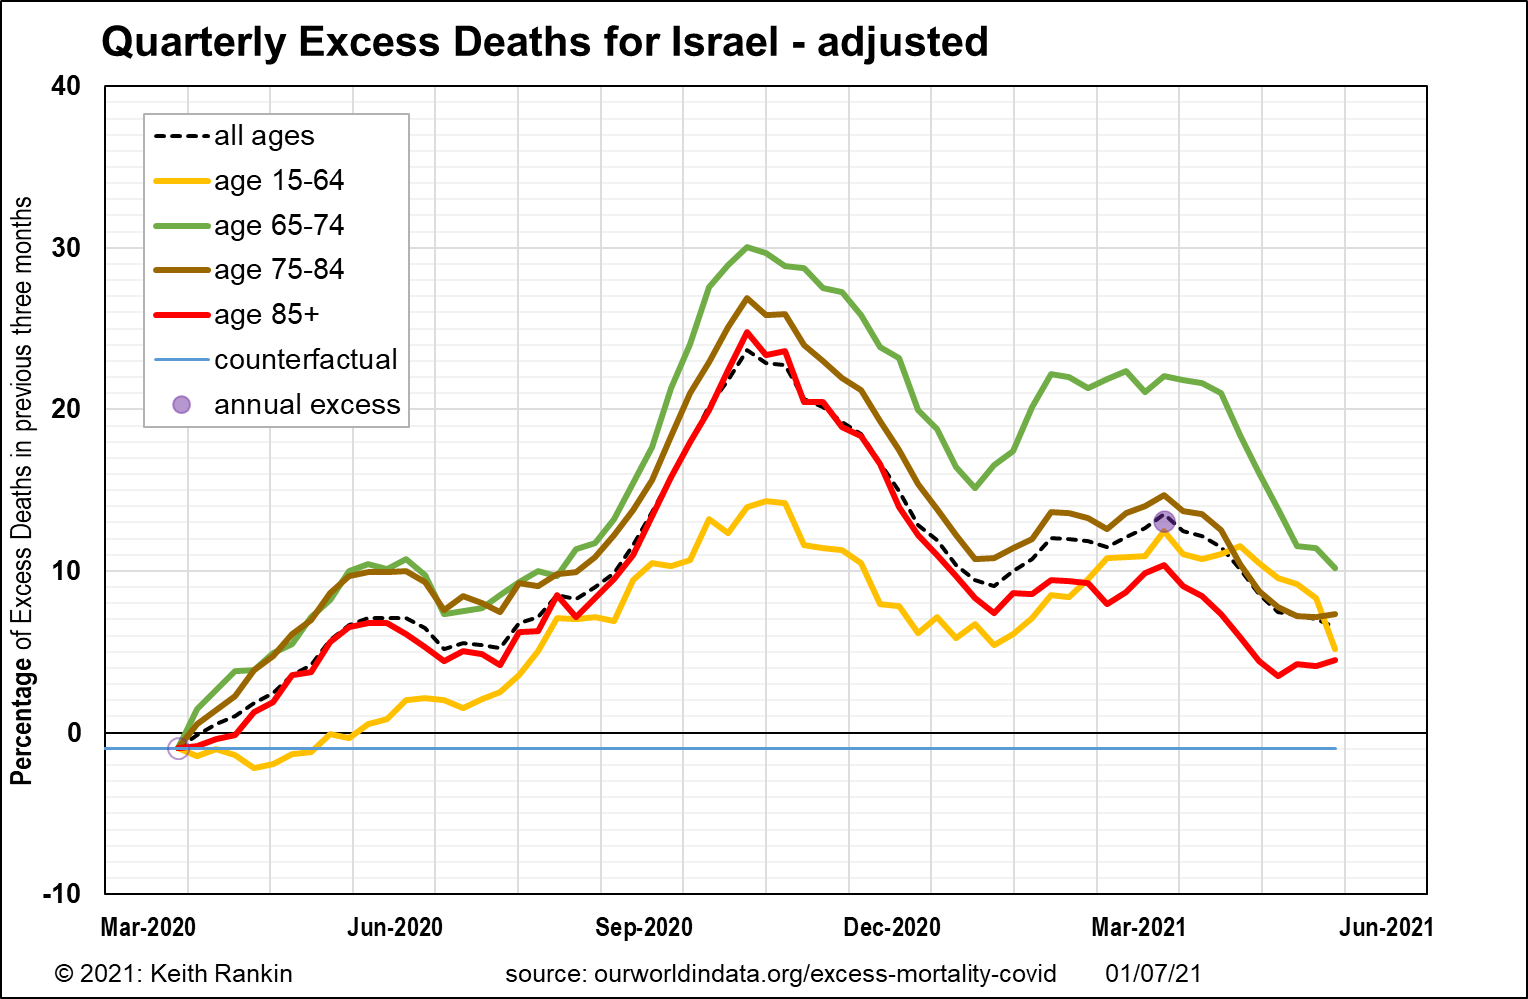
My main comment here is to note that Israel’s peak covid death toll, in October, relates to the whole quarter-year period ending in October; that’s the average for August, September and October combined. This suggests that the outbreak in infections began in July 2020.
Compare Israel’s death toll for 15-64 year-olds with that of Sweden. It is clear that, in Israel, Covid19, transmitted by the young, really was the ‘boomer remover’.


