Analysis by Keith Rankin.
Surpluses and Deficits of Different Economic Sectors
This new series of weekly charts looks at forty years of surpluses and deficits in different countries, showing what makes these countries tick, and why they were where they were – financially speaking – at the end of the 2010s. (We may note, for comparative purposes, two-decade financial balance charts for New Zealand, United Kingdom and European Union’s Eurozone were published last week.)
While we should be careful about regarding any particular financial signature as good or bad, it is probably true to say that the ideal signature would be that, for each of the main sectors – private, government and foreign – its balance would be zero. That would make for very uninteresting charts!
Second from ideal would be that features preponderant in one decade would be offset by opposite features in other decades, meaning that – in the long run – each sector would be in something close to balance. Our first country, Japan, is far from meeting these ‘ideal’ criteria.
Japan is the world’s country with easily the largest public debt, at 238 percent of GDP in 2018(compared to 19.9% for New Zealand). Yet Japan is, and has been for at least four decades, an economic powerhouse. Indeed, Japan has at least as much economic capacity (relative to population) to deal with the Covid19 pandemic as New Zealand does. The level of public debt prior to a pandemic is of little consequence.
Japan’s Signature
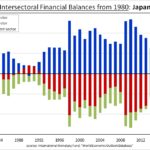
The dominant feature of Japan’s financial signature is its persistent – and persistently high since the mid-1990s – private sector financial surpluses. Japan is very much a nation of excess saving. (The saving sectors are the sectors with positive financial balances.)
What is generally meant to happen is that the two parts of the private sector complement each other: households save, and businesses borrow to invest. Thus, private sector balances should be close to zero, most of the time.
We see from the chart that it is normal for the Japanese private sector to not spend at least five percent of its income; that would normally be understood as Japanese businesses being unable or unwilling to invest at anything like the level required to dispose of household savings. The story however, at least from the early 1990s, is that Japan’s business sector – like its household sector – has been larging a saving sector, rather than an investing sector.
So, Japan’s private savings have been lent to other sectors. Who has spent, as debt, what the private sector could have, but didn’t?
The answer, for the most part, is Japan’s governments – especially its central government. That is indicated by all the red below the chart’s zero balance line. Japan’s government-sector debt is so large because in just about every year the government sector has run a deficit. In many of those years, the government deficits have been higher than five percent of GDP. Simply put, those many years of deficits, unbroken since 1992, have added up to an overall public debt of nearly 240% of GDP.
Not all of Japan’s savings have been spent by its government. In every year since 1980, Japan’s private sector has been a net lender to the rest of the world; to Japan’s (green) foreign sector. This shows up in Japan’s national accounts as an ongoing current account surplus; we may think of it as an excess of exports over imports. Or, put another way, Japan’s private savings (Japan’s credit) have been, to some extent, the means of payment for the rest of the world’s imports of Japanese goods and services. These imports from Japan have been paid for using credit extended by Japan; these imports have – so far – been paid for by Japanese people, not by the foreign purchasers of these imports.
While the Japanese government has spent far more than it has collected in taxes, Japan as a whole – Japan Inc. – has spent significantly less than its national income. Japan is a creditor nation, not a debtor nation; a creditor nation with a debtor government.
From Japan’s point of view, the foreign sector is the entire world outside of Japan. This ‘rest of the world’ has, in total, bought more than it has sold. This is because Japan has sold more goods and services than it has purchased; after all, for the whole world, the amount of goods bought must exactly equal the amount of goods sold.
Japan’s Financial Crisis 30 Years Ago
Japan, along with a number of other countries (eg Australia), had its big financial crisis in the early 1990s. On the chart, it is easy to see when Japan’s financial behaviour deviated from its signature pattern, in the late 1980s.
The late 1980s was a time when Japan, while still an important exporter of high tech manufactured goods, got caught up in a wave of financial speculation, triggered by a big rise in the Yen to US dollar exchange rate. This wave of speculation included an extraordinary real estate bubble. Even Japan’s businesses started borrowing heavily and spending the borrowed money on land and other temporarily appreciating assets.
These speculative private sector ‘behaviours’ were out of character for Japan. Not all Japanese indulged; Japan’s private sector only ran a deficit in one year, 1990.
The result was that huge swathes of Japanese businesses were technically insolvent through the 1990s, and even into the early 2000s. Nevertheless, most the insolvent businesses were able to carry on, so long as they were still able to sell goods to their government, and to foreigners. Japan’s private sector paid down its huge debts as fast as it could, and took on very little new debt despite record low interest rates. (Much of the huge private surpluses in the 1990s were private debt repayments, rather than new savings.)
If Japan’s government had not increased its debt – ie acted as debtor of last resort – then capitalism would have collapsed in Japan. The Japanese government did – thankfully – what all governments should do when interest rates are close to zero. It borrowed.
Japan’s Aversion to Tax Increases
Japanese people dislike paying taxes. In 2014, and again very recently, a seemingly small increase is sales tax has led to significant cutbacks in consumer spending, creating recessions.
The Japanese middle class prefers to lend to its government, rather than be unduly taxed. (It turns out that this is true for many other countries too.) Taxation is a method through which governments force households to not spend part of their income. Saving for the indefinite future – ie saving without any intent to spend the savings – is a method that enables the government to spend money that would otherwise have been taxed. The method, of governments taxing less and borrowing more, works surprisingly well.
The orthodox ‘macroeconomic’ view is that governments should run ‘cyclical’ deficits during economic contractions (eg recessions and other periods of below-average economic growth) and run surpluses during economic expansions. Japan’s government does not follow that prescription. Rather, Japan’s government run’s structural deficits because Japan’s private sector runs structural surpluses. Not only does it work, but it would work just the same if Japan’s accumulated government debt was 500% of GDP.
Japan’s Fiscal Contract
Japan’s implicit contract is that its households will only ask the government to pay back the money if they face some kind of financial emergency. Indeed individual households do face emergencies sometimes, and do get to withdraw their savings. Japan’s middle class knows that, because they happily let the government spend their money, then the chance of a major national emergency is minimised. They expect that, as a sector, Japan’s private households will almost always have savings, and who better to spend those surplus balances than the government. With wholesale interest rates around zero, the Japanese government doesn’t even have to pay interest on its debt.
It is also worthy of note that, over the last five years, Japan’s Budget deficit has been around five percent of GDP every year. Yet its public debt to GDP has only increased from 231% of GDP in 2015 to 238% in 2018, according to tradingeconomics.com.
Japan’s government does not pay back its public debt. Instead, it invests in Japan. Thus, Japan can afford the Olympic Games in 2021; because of its public debt, not despite it. Further, Japan has one of the highest life expectancies in the world, and relatively low inequality. Japan’s people have no reason to fear government debt.