Analysis by Keith Rankin.
The 2018 census has had such a low compliance rate, that it really acted as a large convenience sample (therefore a biased sample) of the New Zealand population. (See my Census Survey from March 2018.) Despite the assurances we are getting, many researchers will have little confidence in its population tallies for towns, districts, and cities. Truths about population redistribution within New Zealand remain elusive.
Unbiassed and factual sources of 2014-2017 population trends are the last two general elections, contested under the same electoral boundaries. My chart for October 2017 – Migration within New Zealand: Evidence from the Election – shows that, based on election votes cast, population growth was slower in Auckland (except Auckland’s outer fringe) than in any other region in the country.
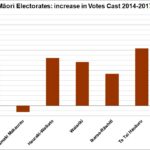
The two main points of this month’s chart are the Māori population decline in Auckland, and the big increase in the south (probably mainly in Wellington, which is in Te Tai Tonga). The Wellington influx probably reflects growth of the bureaucracy, rebuilding after a substantial decrease in its numbers after the 2008 election. Māori have probably been disproportionately affected through this bureaucratic population cycle, given the greater emphasis this decade on biculturalism within the government sector.
While this month’s chart looks only at the Māori electorates, and notwithstanding the Wellington issue, this population dynamic serves as a proxy for all second‑to‑fortieth generation New Zealanders. The big story that the demographers seem to have missed is the recent diaspora of both Māori and Pakeha from Auckland. While the 2018 census was well-timed to capture this, the census‑repair‑process may not.
I was prompted to revisit this issue of demographers’ assumptions after having read an interview with Paul Spoonley – Changing Demographics – in the Winter 2019 AA Directions magazine. Spoonley says “this country is entering [my italics] an era of change”. He adds: “The continual growth of Auckland is predicted. It’s expected that within the next two decades, 40% of all New Zealanders will live in the City of Sails”. And “many regions will experience population stagnation”.
The election data clearly show that the population of central and suburban Auckland has decreased relative to the rest of the country. Māori electorate demographics suggest that only about 15 percent of Māori live in Auckland. Further, the combined population of Auckland’s former cities and borough – Auckland, North Shore, Waitakere, Manukau, Papakura – was most likely (in 2018) less than 30 percent of the national total.
As well as an inexorable Aucklandification, Spoonley describes an imminent process of brownification (Pasifika and Asian, rather than Māori). In fact, that process dates back at least to the 1990s. To back up his view that this change is recent, Spoonley says: “Between 2006 and 2013 our population grew by 35,000 from migration, which is considered modest. Between 2013 and 2018, growth was by 270,000”.
Based on data collected from Statistics New Zealand this week, the 2006‑13 increase was 95,742 and the 2013‑18 increase was 328,133. (These are net passenger statistics, the only truly accurate measure of net population inflow.) But if we adjust the years cited and take the nine years 2001‑09, we get a net inflow of 257,694, giving a somewhat different picture of immigration in that 2000s’ decade. From 2010‑18 – the next nine years – we get a net inflow of 290,054.
2000 itself was a grumpy year in New Zealand, when the $NZ fell below $US0.40, and immigration was substantially negative. Looking at the whole period after 2000, New Zealand experienced an annual average immigration‑sourced population increase of 0.8 percent per year. This was equally true in each decade of this century. (Of course, there was variation in individual years, with the biggest source of variability being the movements of New Zealand citizens; especially variation in the trans‑Tasman flows of New Zealanders.)
Auckland’s Māori population diaspora may or may not show in the coming census data, due to be published in September 2019. And the Aucklander exodus may or may not continue. The main cause of the exodus has most likely been people taking advantage of high prices to sell their houses and make windfall gains. While Auckland real estate prices remain very high, they have been falling relative to the rest of the country since 2017. With much new medium‑high‑density housing coming on stream near to transport nodes, I expect Auckland’s growth will resume, in pace with the rest of the country.