CoveragePost
April 19, 2021
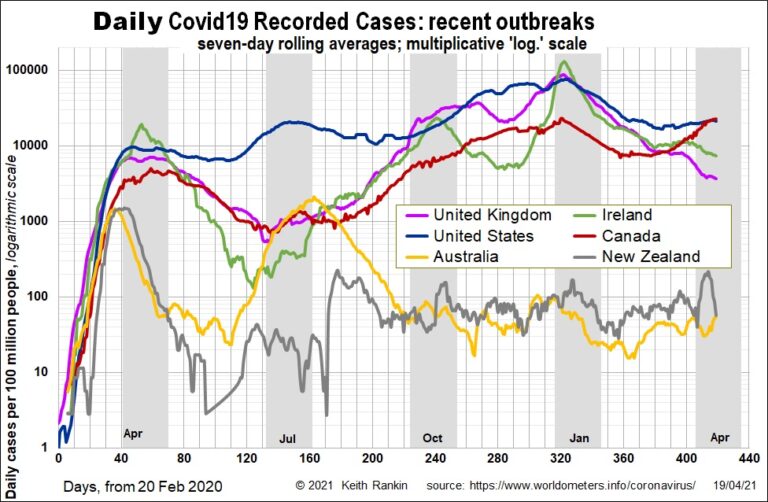
Analysis by Keith Rankin – Covid-19: British Isles and Neo-European Countries Canada has overtaken the United States in the last week, with over 200 daily cases per million people, with the worst growth zones being Ontario, British Columbia and Saskatchewan. However, the United States has some states that are worse, especially Michigan with around 900 ... <a title="Keith Rankin Chart Analysis – Canada Overtakes USA in Covid-19 Cases Per Million" class="read-more" href="https://eveningreport.nz/2021/04/19/keith-rankin-chart-analysis-canada-overtakes-usa-in-covid-19-cases-per-million/" aria-label="Read more about Keith Rankin Chart Analysis – Canada Overtakes USA in Covid-19 Cases Per Million">Read more</a>
CoveragePost
April 16, 2021
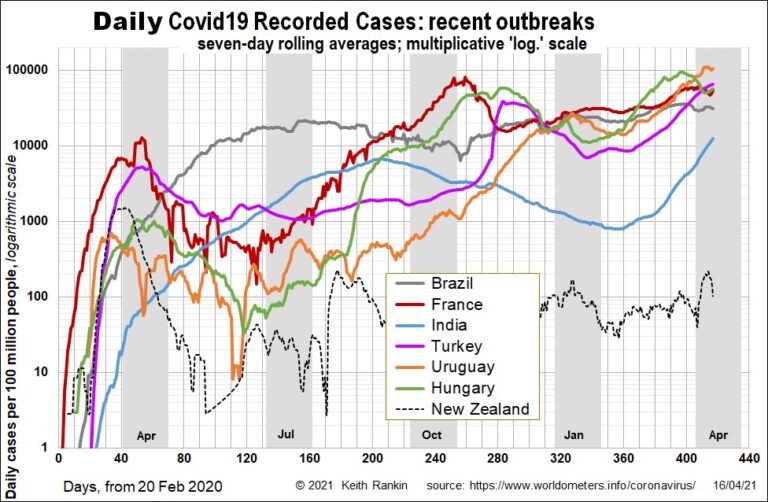
Analysis by Keith Rankin. New Zealand has, for the rest of this month, banned all people who have been in India this month from entry into New Zealand. The decision is based not on the incidence of Covid19 in India; rather it is based on the numbers of New Zealanders arriving from India. This would ... <a title="Keith Rankin Chart Analysis – Covid-19: Countries with recent coronavirus upsurges" class="read-more" href="https://eveningreport.nz/2021/04/16/keith-rankin-chart-analysis-covid-19-countries-with-recent-coronavirus-upsurges/" aria-label="Read more about Keith Rankin Chart Analysis – Covid-19: Countries with recent coronavirus upsurges">Read more</a>
CoveragePost
April 8, 2021
Essay by Keith Rankin. Is the worst of Covid-19 yet to come? The most recent wave of Covid19 is, I suspect, much more significant than the headlines so far would suggest. This phase started in Europe, has been very evident in South America, and is now apparent in Asia (eg Philippines, India, and now Japan.) ... <a title="Keith Rankin Essay – Covid-19 and the Common Cold" class="read-more" href="https://eveningreport.nz/2021/04/08/keith-rankin-essay-covid-19-and-the-common-cold/" aria-label="Read more about Keith Rankin Essay – Covid-19 and the Common Cold">Read more</a>
CoveragePost
March 30, 2021
Essay by Keith Rankin. Getting the Language Correct Aotearoa New Zealand has a housing problem; a very big housing problem, and a problem not unique to New Zealand. While political leaders and privileged commentators do acknowledge the problem, the discussion remains befuddled, presumably largely because of the compromised political and financial interests of those who ... <a title="Keith Rankin Essay – Solving the Housing Crisis: Making Homes" class="read-more" href="https://eveningreport.nz/2021/03/30/keith-rankin-essay-solving-the-housing-crisis-making-homes/" aria-label="Read more about Keith Rankin Essay – Solving the Housing Crisis: Making Homes">Read more</a>
CoveragePost
March 26, 2021
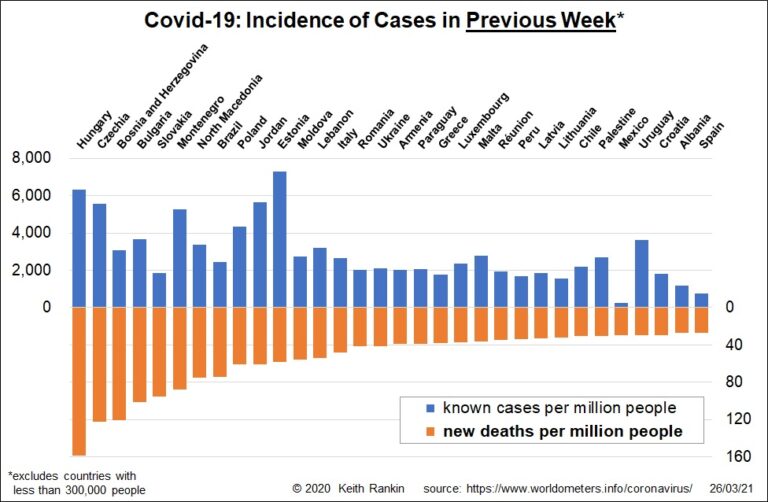
Analysis by Keith Rankin Hungary has now taken over from its neighbour, the Czech Republic, as the world’s most covid-fatal country in the most recent week. The top seven countries are in Eastern Europe, as is the ninth country (Poland); plenty of others from the region also feature. Only Brazil, scoring much higher than in ... <a title="Keith Rankin Chart Analysis – Covid-19: Victims of the latest wave" class="read-more" href="https://eveningreport.nz/2021/03/26/keith-rankin-chart-analysis-covid-19-victims-of-the-latest-wave/" aria-label="Read more about Keith Rankin Chart Analysis – Covid-19: Victims of the latest wave">Read more</a>
CoveragePost
March 23, 2021
Essay by Keith Rankin. “If the nations of the world fail to honour the pledges they made in Paris, the climate could return to Pliocene conditions when okapi-like creatures and giant vipers thrived in Europe. … Ernst Haeckel’s name for our Neanderthal ancestors, homo stupidus, may yet have some validity – for us.” Tim Flannery, ... <a title="Keith Rankin Essay – Homo Stupidus?" class="read-more" href="https://eveningreport.nz/2021/03/23/keith-rankin-essay-homo-stupidus/" aria-label="Read more about Keith Rankin Essay – Homo Stupidus?">Read more</a>
CoveragePost
March 19, 2021
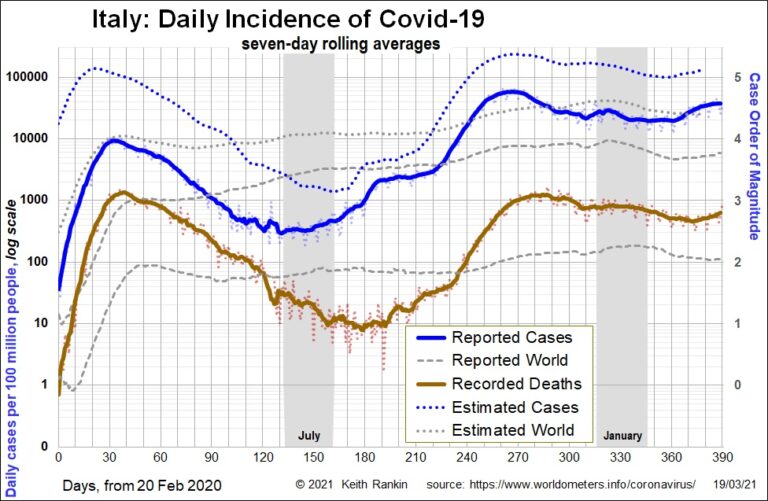
Analysis by Keith Rankin. Italy and Spain were the first major European entry points for Covid19. The pandemic appears to have spread to the rest of the Europe mainly from Italy, and to the rest of the world from Europe. Most of the world’s first dramatic news pictures of hospital wards and burial caskets came ... <a title="Keith Rankin Chart Analysis – Covid-19: A New Wave?" class="read-more" href="https://eveningreport.nz/2021/03/19/keith-rankin-chart-analysis-covid-19-a-new-wave/" aria-label="Read more about Keith Rankin Chart Analysis – Covid-19: A New Wave?">Read more</a>
CoveragePost
March 16, 2021
Essay by Keith Rankin. “What psychologists call apophenia – the human tendency to see connections and patterns that are not really there – gives rise to conspiracy theories”. https://www.merriam-webster.com/dictionary/apophenia The Gordon Riots “June 1780 [witnessed] the worst mob riots of the eighteenth century. Lord George Gordon was a born incendiary of extreme, almost insane, views. ... <a title="Keith Rankin Essay – Apophenia" class="read-more" href="https://eveningreport.nz/2021/03/16/keith-rankin-essay-apophenia/" aria-label="Read more about Keith Rankin Essay – Apophenia">Read more</a>
CoveragePost
March 12, 2021
Essay by Keith Rankin. “… a future where certain people think of people as being of value for what they can provide to the dominant class” Jessie Mulligan, ‘Afternoons’ on RNZ (9 March 2021), quoted from “Book Critic” (8:00′) Historical Background Societies split into two strata following the post ice age (Neolithic) agricultural revolution. The ... <a title="Keith Rankin Essay – The International Labour System" class="read-more" href="https://eveningreport.nz/2021/03/12/keith-rankin-essay-the-international-labour-system/" aria-label="Read more about Keith Rankin Essay – The International Labour System">Read more</a>
CoveragePost
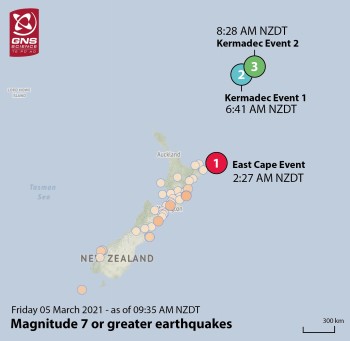
March 8, 2021
Essay by Keith Rankin. On Friday at 6am I woke up in Covid Level 3 Auckland to news of a big earthquake around 100km east of East Cape, at about 2:30am. While many people in Auckland had apparently felt it, many more had uninterrupted sleep. Descriptions on Radio New Zealand’s Morning Reportsuggested that this was ... <a title="Keith Rankin Essay – Friday’s Tsunami Messaging: Why Not Tauranga and Auckland?" class="read-more" href="https://eveningreport.nz/2021/03/08/keith-rankin-essay-fridays-tsunami-messaging-why-not-tauranga-and-auckland/" aria-label="Read more about Keith Rankin Essay – Friday’s Tsunami Messaging: Why Not Tauranga and Auckland?">Read more</a>
CoveragePost
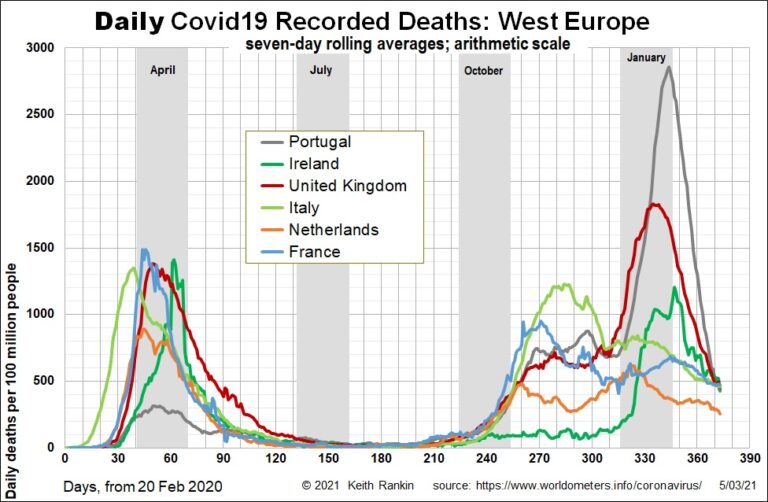
March 5, 2021
Analysis by Keith Rankin. At first glance through our rear-vision mirror, western Europe had a substantial spring outbreak of Covid19, and further outbreaks in spring and autumn. Three countries really ‘spiked’ in the northern winter: United Kingdom, Portugal and Ireland. This was the impact of the “more transmissible” ‘UK variant’. While the other countries shown ... <a title="Keith Rankin Chart Analysis – Covid-19: Europe still a matter of concern, one year on" class="read-more" href="https://eveningreport.nz/2021/03/05/keith-rankin-chart-analysis-covid-19-europe-still-a-matter-of-concern-one-year-on/" aria-label="Read more about Keith Rankin Chart Analysis – Covid-19: Europe still a matter of concern, one year on">Read more</a>
CoveragePost
March 3, 2021
Essay by Keith Rankin. I’m a neanderthal man You’re not a neanderthal girl Let’s make hybrid love In this neanderthal world [with apologies to Hotlegs, 1970] Homo Stupidus? After my partner read Dan Salmon’s novel Neands – written during lockdown in 2020 – I decided to renew my interest in our distant ancestry, in part ... <a title="Keith Rankin Essay – Our Neanderthal Ancestry" class="read-more" href="https://eveningreport.nz/2021/03/03/keith-rankin-essay-our-neanderthal-ancestry/" aria-label="Read more about Keith Rankin Essay – Our Neanderthal Ancestry">Read more</a>