CoveragePost
October 12, 2023
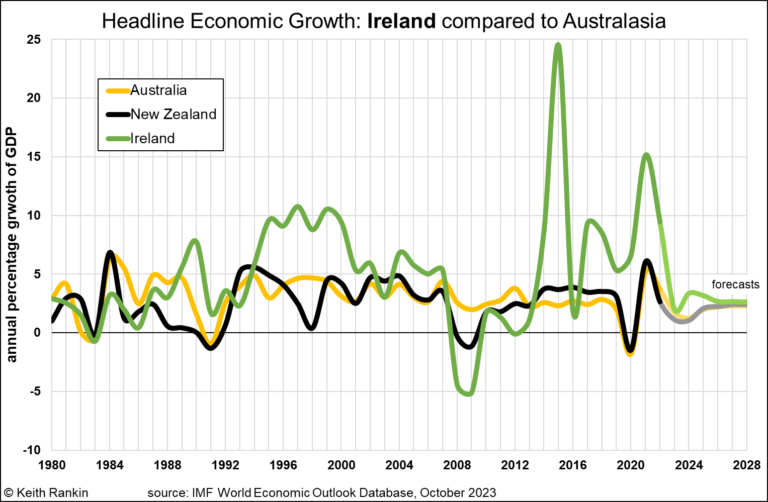
Analysis by Keith Rankin. This chart shows the anomalous economy which is Ireland. In tradingeconomics.com, Ireland and New Zealand are shown as having exactly the same population (5.15m). Yet Ireland has a GDP of $US529 billion, whereas New Zealand has a GDP of $US247 billion, less than half. (Even Sweden, with double Ireland’s population, has ... <a title="Keith Rankin Chart Analysis – Economic Growth: Ireland compared to Australasia" class="read-more" href="https://eveningreport.nz/2023/10/12/keith-rankin-chart-analysis-economic-growth-ireland-compared-to-australasia/" aria-label="Read more about Keith Rankin Chart Analysis – Economic Growth: Ireland compared to Australasia">Read more</a>
CoveragePost
October 5, 2023
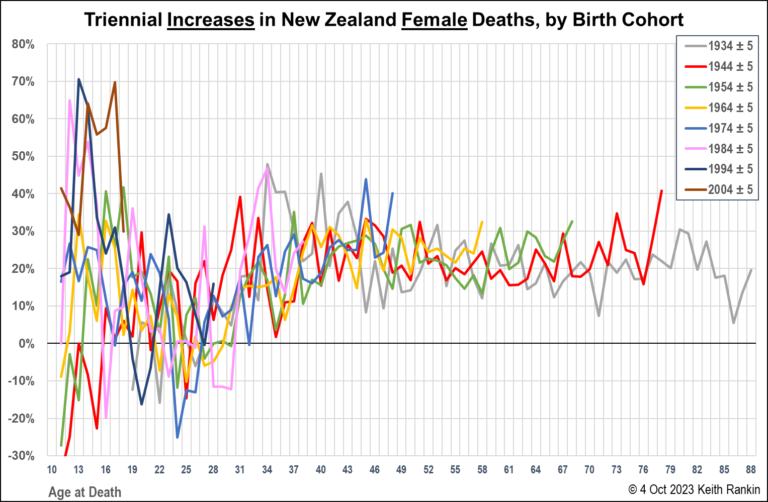
Analysis by Keith Rankin. The above chart looks rather noisy, and so it should. Life and death are messy, and subject to random variations. But this chart, for females, and those that follow, are important charts. It’s worth looking through the ‘random noise’. These charts suggest that the cliché ‘we are all living longer’ is ... <a title="Keith Rankin Chart Analysis – Mortality Increases in New Zealand, by Generation and Sex" class="read-more" href="https://eveningreport.nz/2023/10/05/keith-rankin-chart-analysis-mortality-increases-in-new-zealand-by-generation-and-sex/" aria-label="Read more about Keith Rankin Chart Analysis – Mortality Increases in New Zealand, by Generation and Sex">Read more</a>
CoveragePost
September 26, 2023
Analysis by Keith Rankin. The principal measure of economic success in the mainstream narrative is economic growth. The pointy heads associated with that narrative will correctly point out that its economic growth per capita that matters, and which serves as a crude proxy for ‘living standards’. This conventional wisdom says that annual economic growth of ... <a title="Keith Rankin Chart Analysis – Economic Growth per Capita: New Zealand in Context" class="read-more" href="https://eveningreport.nz/2023/09/26/keith-rankin-chart-analysis-economic-growth-per-capita-new-zealand-in-context/" aria-label="Read more about Keith Rankin Chart Analysis – Economic Growth per Capita: New Zealand in Context">Read more</a>
CoveragePost
September 15, 2023
Analysis by Keith Rankin. The chart above looks at the changing numbers of deaths for New Zealand’s seven adult generations. The numbers are ‘triennial’ – three-year percentage increases. For example, in 2020, twenty percent (20%) more Generation-Y people died than three years earlier; with ‘three years earlier defined as the average for years 2015 to 2019, ... <a title="Keith Rankin Chart Analysis – Triennial increases in Deaths in New Zealand by Generation" class="read-more" href="https://eveningreport.nz/2023/09/15/keith-rankin-chart-analysis-triennial-increases-in-deaths-in-new-zealand-by-generation/" aria-label="Read more about Keith Rankin Chart Analysis – Triennial increases in Deaths in New Zealand by Generation">Read more</a>
CoveragePost
September 7, 2023
Analysis by Keith Rankin. This chart shows total deaths in a number of comparable countries with high or highish life expectancies. The countries with most deaths have older populations. New Zealand should perhaps be compared most with Ireland, Scotland, Denmark and Finland; all countries with just over five million people. And with Australia. Australian ... <a title="Keith Rankin Chart Analysis – Deaths as an Indicator of Population Age Structure and the increasing Demand for Health Care" class="read-more" href="https://eveningreport.nz/2023/09/07/keith-rankin-chart-analysis-deaths-as-an-indicator-of-population-age-structure-and-the-increasing-demand-for-health-care/" aria-label="Read more about Keith Rankin Chart Analysis – Deaths as an Indicator of Population Age Structure and the increasing Demand for Health Care">Read more</a>
CoveragePost
August 31, 2023
Analysis by Keith Rankin. New Zealand’s Exceptional Economic Policy Fingerprint The above chart shows New Zealand’s financial (im)balances from 1999. What is truly exceptional is the number of years in which Aotearoa New Zealand has green and red together on the ‘surplus’ side of the chart. (I have discussed this in May in Visualising Countries’ ... <a title="Keith Rankin Chart Analysis – New Zealand’s Financial Exceptionalism" class="read-more" href="https://eveningreport.nz/2023/08/31/keith-rankin-chart-analysis-new-zealands-financial-exceptionalism/" aria-label="Read more about Keith Rankin Chart Analysis – New Zealand’s Financial Exceptionalism">Read more</a>
CoveragePost
August 7, 2023
Analysis by Keith Rankin. These three countries are very useful comparators because they have broadly similar demographics – especially population age structures – to each other. Further they have comparable living standards. The Republic of Ireland has a population the same size as New Zealand (and a similar climate); Australia has close to five ... <a title="Keith Rankin Chart Analysis – Seasonal Profile of Deaths in Ireland, New Zealand, and Australia: 2015-2023" class="read-more" href="https://eveningreport.nz/2023/08/07/keith-rankin-chart-analysis-seasonal-profile-of-deaths-in-ireland-new-zealand-and-australia-2015-2023/" aria-label="Read more about Keith Rankin Chart Analysis – Seasonal Profile of Deaths in Ireland, New Zealand, and Australia: 2015-2023">Read more</a>
CoveragePost
June 13, 2023
Analysis by Keith Rankin. The above chart draws on the historical ‘births, deaths, and marriages’ dataset published by the Ministry of Internal Affairs. It’s a major resource for genealogical research. The database for 13 June 2023 showed the deaths of all people whose deaths were registered in New Zealand on or before 13 June 1973. ... <a title="Keith Rankin Chart Analysis – Granny Smith" class="read-more" href="https://eveningreport.nz/2023/06/13/keith-rankin-chart-analysis-granny-smith/" aria-label="Read more about Keith Rankin Chart Analysis – Granny Smith">Read more</a>
CoveragePost
May 29, 2023
Analysis by Keith Rankin. The topic of financial debt is one of the hardest for humans to get their heads around. The normal understanding of a debt is a sacrifice made by one party (the owner of the debt) in favour of another party (the ower) which will be remedied some time in the future ... <a title="Keith Rankin Chart Analysis – Visualising Countries’ Deficits and Debts, Surpluses and Credits, in context of the US Government’s Debt Ceiling" class="read-more" href="https://eveningreport.nz/2023/05/29/keith-rankin-chart-analysis-visualising-countries-deficits-and-debts-surpluses-and-credits-in-context-of-the-us-governments-debt-ceiling/" aria-label="Read more about Keith Rankin Chart Analysis – Visualising Countries’ Deficits and Debts, Surpluses and Credits, in context of the US Government’s Debt Ceiling">Read more</a>
CoveragePost
March 27, 2023
Analysis by Keith Rankin. The ‘Young Elderly’ are in essence the post-war baby-boomers. An average young elderly person in these charts was born around 1950 to 1952. The charts look at ‘quarterly excess deaths’, so do not show week-by-week fluctuations in deaths. For example, data for the very end of 2022 covers the whole ... <a title="Keith Rankin Chart Analysis – The Pandemic: Young Elderly Deaths in Europe, USA and New Zealand" class="read-more" href="https://eveningreport.nz/2023/03/27/keith-rankin-chart-analysis-the-pandemic-young-elderly-deaths-in-europe-usa-and-new-zealand/" aria-label="Read more about Keith Rankin Chart Analysis – The Pandemic: Young Elderly Deaths in Europe, USA and New Zealand">Read more</a>
CoveragePost
March 12, 2023
Analysis by Keith Rankin. The chart above is quite alarming, and not only because of Germany’s high death toll. It’s the difference between reported Covid19 deaths and excess deaths, in the context where four waves of excess deaths in Germany in 2022 are clearly ‘epidemic’ in nature. And we see the same death waves in ... <a title="Keith Rankin Chart Analysis – Death Spikes and Covid Dissonance? Examples of Germany and Denmark" class="read-more" href="https://eveningreport.nz/2023/03/12/keith-rankin-chart-analysis-death-spikes-and-covid-dissonance-examples-of-germany-and-denmark/" aria-label="Read more about Keith Rankin Chart Analysis – Death Spikes and Covid Dissonance? Examples of Germany and Denmark">Read more</a>
CoveragePost
March 3, 2023
Analysis by Keith Rankin. Quantity of Life With mortality data now available for many countries to the end of 2022 (and, for a few countries, for a month into 2023), we are now able to properly assess the demographic cost of the Covid19 pandemic. There is a proviso, in that for a number of countries, ... <a title="Keith Rankin Chart Analysis – Covid19 pandemic: Mortality in the 2020s, Australasia, Sweden and elsewhere" class="read-more" href="https://eveningreport.nz/2023/03/03/keith-rankin-chart-analysis-covid19-pandemic-mortality-in-the-2020s-australasia-sweden-and-elsewhere/" aria-label="Read more about Keith Rankin Chart Analysis – Covid19 pandemic: Mortality in the 2020s, Australasia, Sweden and elsewhere">Read more</a>