CoveragePost
September 26, 2024
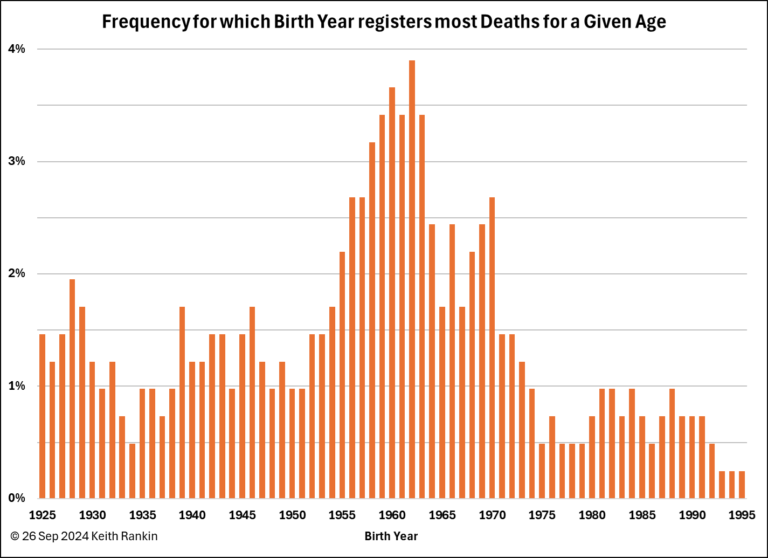
Analysis by Keith Rankin. This chart essentially shows the stresses that New Zealand’s public health system can expect to face. I have analysed the death data by age, covering all deaths from July 1998 to June 2024. For those years (using June years) I have looked at every age of death from 16 to 99 ... <a title="Keith Rankin Chart Analysis – Death Frequencies in Aotearoa New Zealand, by Birth Year" class="read-more" href="https://eveningreport.nz/2024/09/26/keith-rankin-chart-analysis-death-frequencies-in-aotearoa-new-zealand-by-birth-year/" aria-label="Read more about Keith Rankin Chart Analysis – Death Frequencies in Aotearoa New Zealand, by Birth Year">Read more</a>
CoveragePost
August 4, 2024
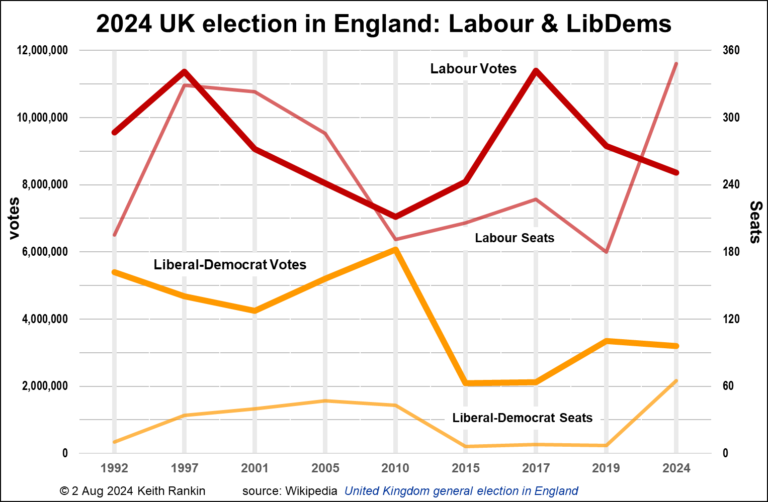
Analysis by Keith Rankin. The above chart shows the votes for the principal ‘leftish’ political parties in England from 1992 to 2024. The important thing to note is that vote tallies should be rising over time in any country which has a rising population. England had had a rising population trend, yet the numbers of ... <a title="Keith Rankin Chart Analysis – The Political Left in England; an Analysis of Election Vote Counts" class="read-more" href="https://eveningreport.nz/2024/08/04/keith-rankin-chart-analysis-the-political-left-in-england-an-analysis-of-election-vote-counts/" aria-label="Read more about Keith Rankin Chart Analysis – The Political Left in England; an Analysis of Election Vote Counts">Read more</a>
CoveragePost
July 31, 2024
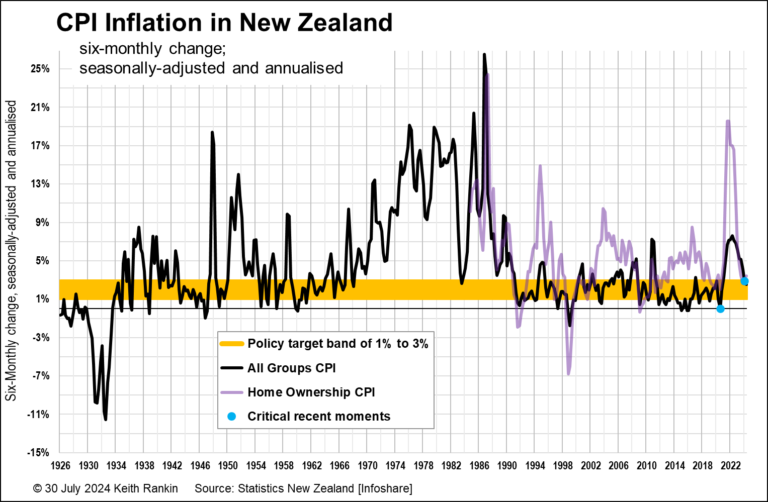
Analysis by Keith Rankin. The above chart shows CPI inflation in New Zealand in historical context. The chart shows (in orange) the present policy target band of one to three percent annual inflation. And it shows the ‘home-ownership’ component of the CPI. The chart looks different to most charts of CPI inflation, because it uses ... <a title="Keith Rankin Chart Analysis – New Zealand’s Consumers Price Index: CPI Inflation past and present" class="read-more" href="https://eveningreport.nz/2024/07/31/keith-rankin-chart-analysis-new-zealands-consumers-price-index-cpi-inflation-past-and-present/" aria-label="Read more about Keith Rankin Chart Analysis – New Zealand’s Consumers Price Index: CPI Inflation past and present">Read more</a>
CoveragePost
July 22, 2024
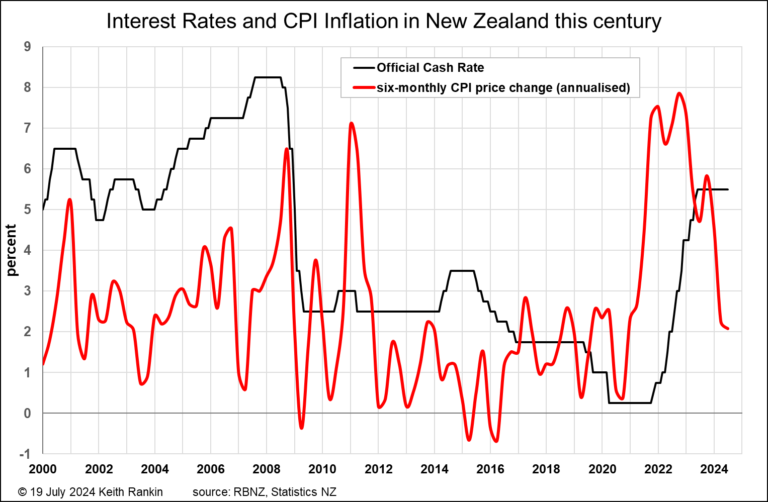
Analysis by Keith Rankin. Interest Rates and Increasing Prices: The Facts The first chart above challenges the received view that inflation in New Zealand remains stubbornly high, and that it is therefore appropriate for the Reserve Bank’s official cash rate (OCR) to be held for at least a few more months at its damagingly high ... <a title="Keith Rankin Chart Analysis – The Truth in New Zealand about Price Inflation and Interest Rates" class="read-more" href="https://eveningreport.nz/2024/07/22/keith-rankin-chart-analysis-the-truth-in-new-zealand-about-price-inflation-and-interest-rates/" aria-label="Read more about Keith Rankin Chart Analysis – The Truth in New Zealand about Price Inflation and Interest Rates">Read more</a>
CoveragePost
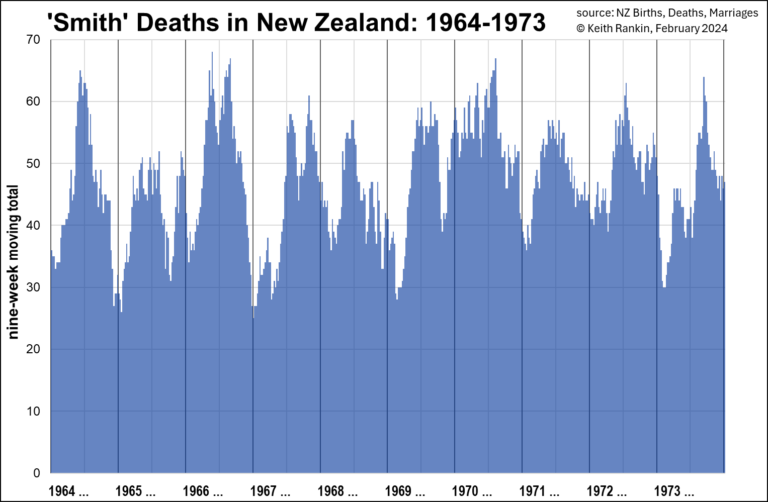
February 13, 2024
Analysis by Keith Rankin Generally, more people die in winter. Not surprising, though some years have significantly more deaths than others, and the timing of ‘peak death’ each year varies between the wintery months. These charts show the deaths, determined from weekly data, of people named Smith, New Zealand’s most common surname last century. The ... <a title="Keith Rankin Chart Analysis – New Zealand Post-War Mortality: Seasonal Patterns" class="read-more" href="https://eveningreport.nz/2024/02/13/keith-rankin-chart-analysis-new-zealand-post-war-mortality-seasonal-patterns/" aria-label="Read more about Keith Rankin Chart Analysis – New Zealand Post-War Mortality: Seasonal Patterns">Read more</a>
CoveragePost
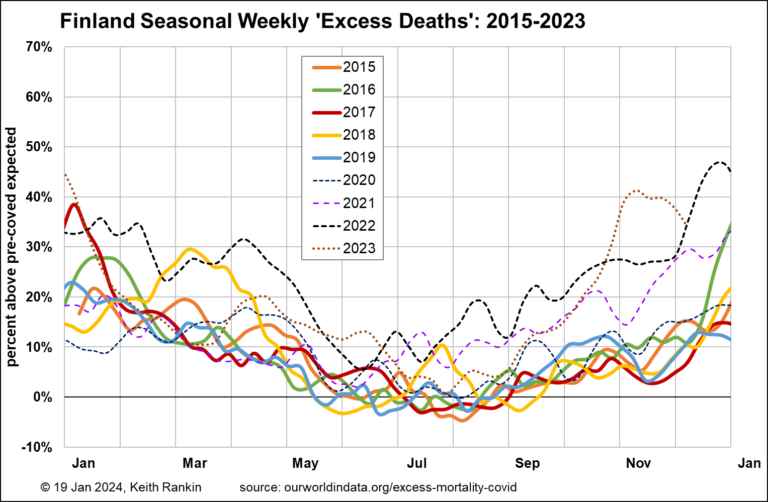
January 19, 2024
Analysis by Keith Rankin. In the European Union at least, mortality data is now available until close to the end of 2023. In northern Europe, mortality has been markedly higher than it should have been in the ‘Fall’ – autumn – of 2023. The main exception is Poland. Respiratory illness is most likely the culprit. ... <a title="Keith Rankin Chart Analysis – Excess Mortality to Fall 2023: mainly Northeast Europe" class="read-more" href="https://eveningreport.nz/2024/01/19/keith-rankin-chart-analysis-excess-mortality-to-fall-2023-mainly-northeast-europe/" aria-label="Read more about Keith Rankin Chart Analysis – Excess Mortality to Fall 2023: mainly Northeast Europe">Read more</a>
CoveragePost
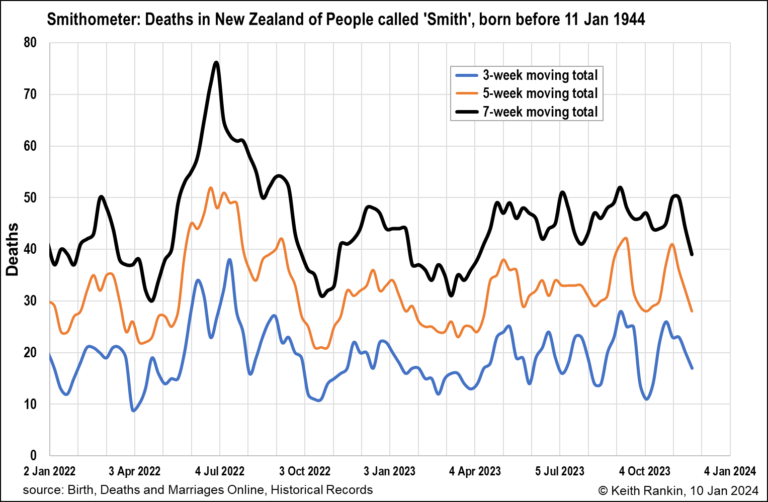
January 10, 2024
Analysis by Keith Rankin. In the absence of more detailed recent data on deaths in New Zealand, the Smithometer acts as a good proxy for older New Zealanders’ mortality. The Smithometer includes all New Zealand deaths where the persons’ surnames are Smith, including women with birth surnames of Smith. So, the Smithometer most reflects the ... <a title="Keith Rankin Analysis – Mortality of Older New Zealanders, the Latest Smithometer" class="read-more" href="https://eveningreport.nz/2024/01/10/keith-rankin-analysis-mortality-of-older-new-zealanders-the-latest-smithometer/" aria-label="Read more about Keith Rankin Analysis – Mortality of Older New Zealanders, the Latest Smithometer">Read more</a>
CoveragePost
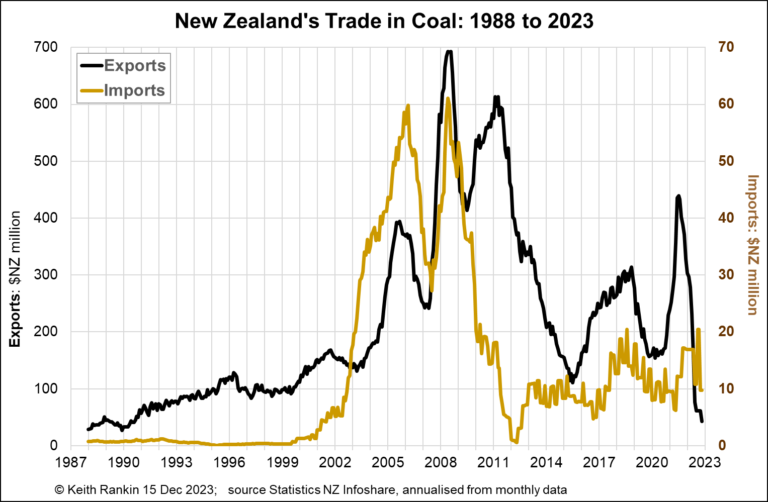
December 15, 2023
Analysis by Keith Rankin. The chart above shows Aotearoa New Zealand’s exports and imports of coal. First, note that the emphasis is on timing, not absolute amounts; Imports have a different scale to Exports. Essentially, imports have been around 10% of exports. It’s also important to note that most Aotearoan coal is exported, while coal ... <a title="Keith Rankin Chart Analysis – New Zealand’s Coal Trade" class="read-more" href="https://eveningreport.nz/2023/12/15/keith-rankin-chart-analysis-new-zealands-coal-trade/" aria-label="Read more about Keith Rankin Chart Analysis – New Zealand’s Coal Trade">Read more</a>
CoveragePost
October 30, 2023
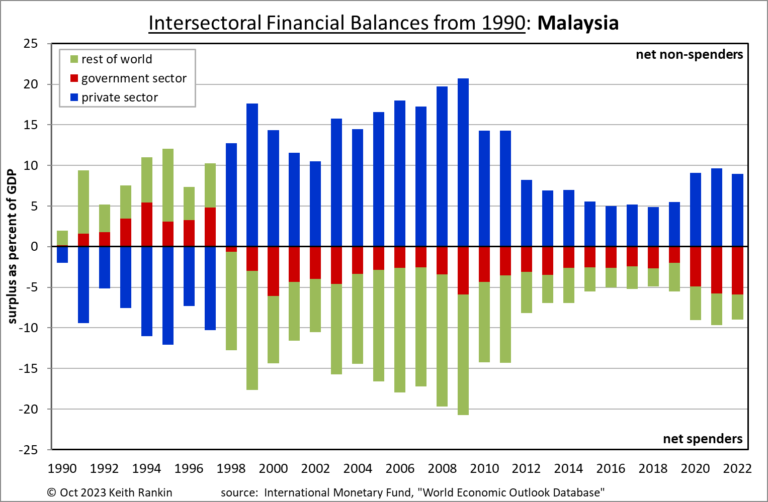
Analysis. by Keith Rankin. On 26 October I wrote about New Zealand’s exceptional financial model, showing it to take a similar (though non-fraudulent) form to a Ponzi Scheme (The Ponzi financial model and New Zealand’s monetary policy). And I showed how this kind of financial behaviour by a nation-state could help to stabilise a world ... <a title="Keith Rankin Chart Analysis – Interesting Financial Fingerprints: Malaysia, Switzerland, United Kingdom, Israel" class="read-more" href="https://eveningreport.nz/2023/10/30/keith-rankin-chart-analysis-interesting-financial-fingerprints-malaysia-switzerland-united-kingdom-israel/" aria-label="Read more about Keith Rankin Chart Analysis – Interesting Financial Fingerprints: Malaysia, Switzerland, United Kingdom, Israel">Read more</a>
CoveragePost
October 17, 2023
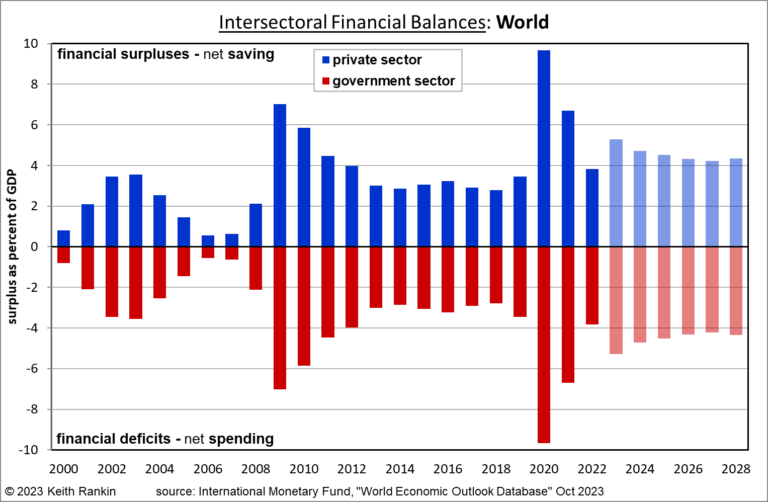
Analysis by Keith Rankin. The above chart shows that the world’s governments, taken collectively, run financial deficits every year. This is not a weakness of the global financial system; it’s a strength, perhaps the strength of the world system. Government deficits offset private sector financial choices. We note that when the world government deficit becomes ... <a title="Keith Rankin Chart Analysis – Governments run financial deficits; it’s their role to do so" class="read-more" href="https://eveningreport.nz/2023/10/17/keith-rankin-chart-analysis-governments-run-financial-deficits-its-their-role-to-do-so/" aria-label="Read more about Keith Rankin Chart Analysis – Governments run financial deficits; it’s their role to do so">Read more</a>
CoveragePost
October 12, 2023
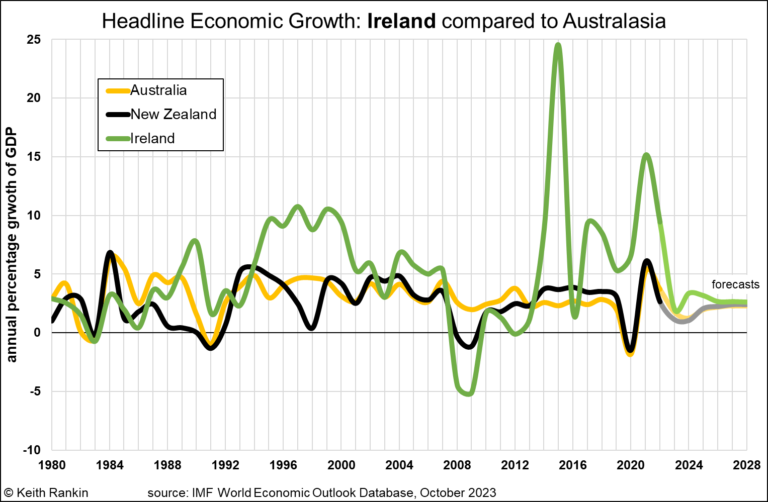
Analysis by Keith Rankin. This chart shows the anomalous economy which is Ireland. In tradingeconomics.com, Ireland and New Zealand are shown as having exactly the same population (5.15m). Yet Ireland has a GDP of $US529 billion, whereas New Zealand has a GDP of $US247 billion, less than half. (Even Sweden, with double Ireland’s population, has ... <a title="Keith Rankin Chart Analysis – Economic Growth: Ireland compared to Australasia" class="read-more" href="https://eveningreport.nz/2023/10/12/keith-rankin-chart-analysis-economic-growth-ireland-compared-to-australasia/" aria-label="Read more about Keith Rankin Chart Analysis – Economic Growth: Ireland compared to Australasia">Read more</a>
CoveragePost
October 5, 2023
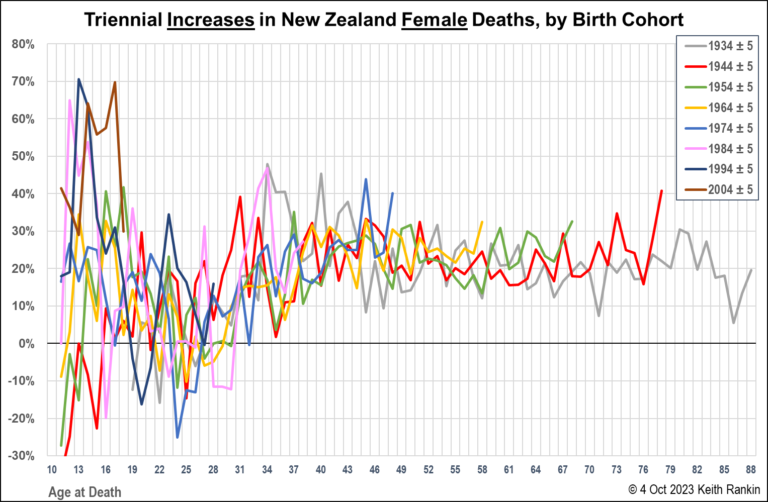
Analysis by Keith Rankin. The above chart looks rather noisy, and so it should. Life and death are messy, and subject to random variations. But this chart, for females, and those that follow, are important charts. It’s worth looking through the ‘random noise’. These charts suggest that the cliché ‘we are all living longer’ is ... <a title="Keith Rankin Chart Analysis – Mortality Increases in New Zealand, by Generation and Sex" class="read-more" href="https://eveningreport.nz/2023/10/05/keith-rankin-chart-analysis-mortality-increases-in-new-zealand-by-generation-and-sex/" aria-label="Read more about Keith Rankin Chart Analysis – Mortality Increases in New Zealand, by Generation and Sex">Read more</a>