Analysis by Keith Rankin.
The following tables represent an update of mortality by sex in relation to Table 2 from Decennial Increases in Deaths by Birth Cohort, in Aotearoa New Zealand.
By looking at deaths registered in February to May only, it is possible to extend trends into 2025, avoiding fluctuations arising from winter illnesses.
The numbers look at people born over a ten-year period and the percentage increase in deaths in a given recent year compared to ten-years earlier. I am most interested in the ‘generations’ born between 1935 and 1990. The oldest generation/cohort shown will not have many more deaths than ten years earlier, because more than half have already died before the age of ninety. For younger generations, only a small minority have already died, meaning that a population can be readily compared with its younger self.
Results are unreliable for people under 25, because too few of them die to reveal any patterns.
Typically, at least for working-age adults – defining working age here to mean about 25 to about 75 – a birth cohort will normally have about 100% more deaths in a given year (eg 2020) compared to ten years previously. We can see that in the Male table below, by looking at the 2010-2020 column, and by looking at the 1935-45+ row.
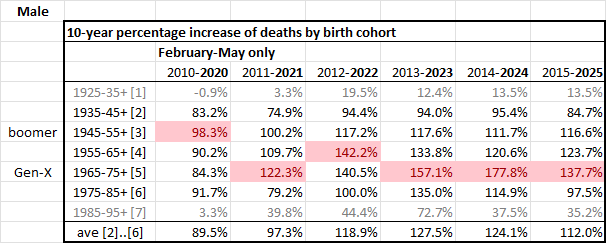
If we look at the first highlighted figure of 98.3%, it means that 98.3% more men born from 1945 to 1954 died in 2020 than in 2010. The next figure in that row says that 100.2% more men born from 1946 to 1955 died in 2021 than in 2011. The last figure for that row says that 119.4% more men born from 1950 to 1959 died in 2025 than in 2015. (Noting again, that these data are for February to May only.)
This decade we have observed some problematic increases in deaths for men born between 1955 and 1980. (I would rate any number over 120% as ‘problematic’.)
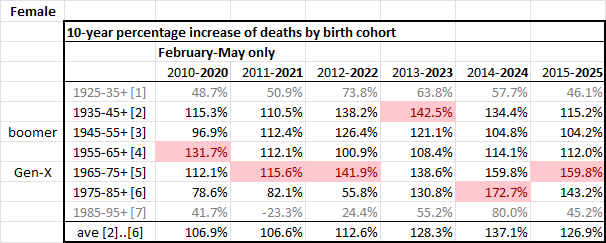
For Females, these increases in death numbers over ten years for a generation/cohort are even more concerning; though it remains true that fewer working-age females are dying than working-age males. It’s more that women are catching up to men. As with men, it is those women born between 1955 and 1980 where the greatest concern lies.
While I’ll leave these data for others to interpret further, the numbers tend to bely the mantra we hear from the finance industry and many politicians that “we are all living longer”. The aging process seems to be coming earlier for people born after 1955 than for people born before that year. (It’s too early to say whether this conclusion about ‘Gen-X’ will also apply to ‘Gen-Y’. While Gen-Y men, born after 1975, seem to be doing OK so far, data for Gen-Y females is not looking too good.)
A final point to note is that Aotearoa’s working-age population is particularly affected by immigration and emigration. The numbers given here will be distorted if, for any cohort within that ten-year period of comparison, there was a marked difference in emigration compared to immigration. We should note, however, that both immigrants and emigrants (to and from Aotearoa New Zealand) tend to be healthier than average for their birth cohorts. Thus, data of this type – which does not rely on population denominators – can reveal subtle truths which may otherwise remain hidden.
Ultimately, societal problems – such as inequality, insecure housing, over- and under-work – all do have an impact on average lifespan at least as much (if not more) than the state of a country’s healthcare services. Actuarial methods of measuring lifespan are lagging indicators of the health of a national population. And they can be problematic in this country, because so many people who will die in New Zealand were not born here; and vice versa.
My tables are forward-looking rather than backward-looking. They warn of trouble ahead, especially in relation to those people born in the 1970s and 1980s. We may note the following: What researchers suspect may be fuelling cancer among millennials (Washington Post article, published in NZ Herald on 30 September 2025).
*******
Data is from Statistics New Zealand, Births and deaths: Year ended June 2025. That data series only begins in 2010.
Keith Rankin (keith at rankin dot nz), trained as an economic historian, is a retired lecturer in Economics and Statistics. He lives in Auckland, New Zealand.


