
Analysis by Keith Rankin.
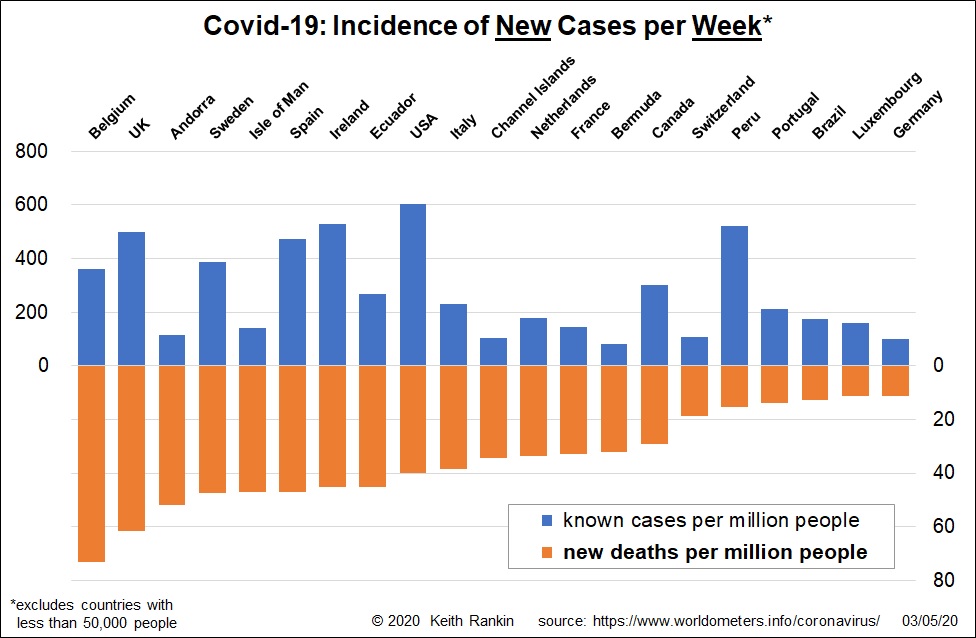
These two charts show the total number of cases and deaths, by country, over the seven days ended 2 May 2020. In these charts a number of countries with populations below 50,000 have been omitted; countries which have shown in earlier charts.
The first chart is sequenced by death rates (orange). Generally it shows the countries that have featured in the past, suggesting that the pandemic continues to be concentrated in the same places – the economically developed countries that were too slow to act. We note that, when we extend the United Kingdom to the British Isles, that Ireland and the Isle of Man make strong appearances reflecting their interconnectedness. Further, the Channel Islands and Bermuda – functionally part of the United Kingdom – match these British territories.
We also see the appearance of Latin American countries: Ecuador, Peru and Brazil.
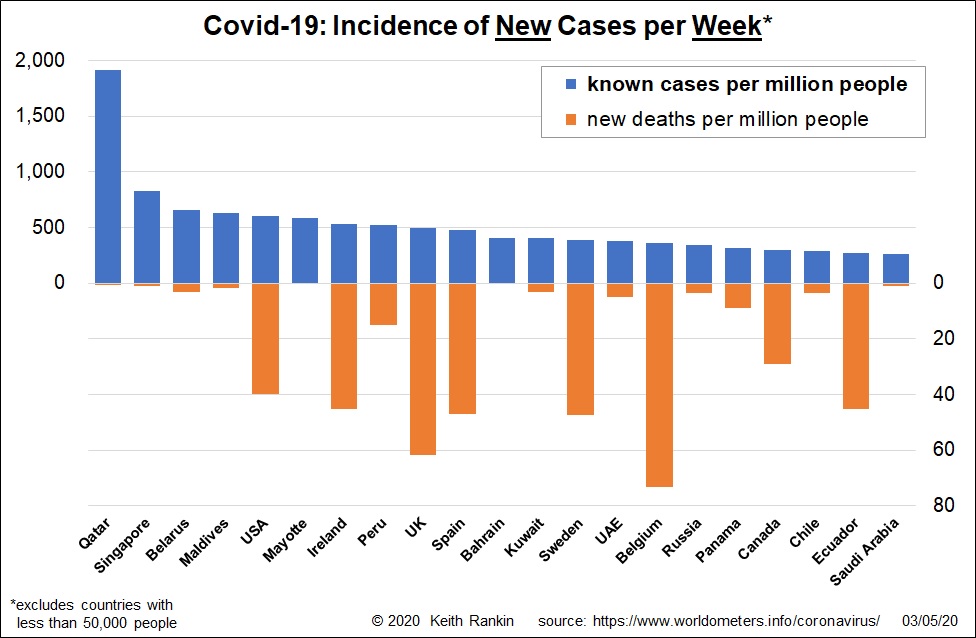
The second chart shows the reappearance of Qatar, Bahrain, Kuwait, UAE; also, Singapore. And the inclusion of Saudi Arabia with them. These six countries continue to have low death rates. It seems likely that the Arabian countries will generally share the experience of Singapore; in many ways they are similar societies with similar economies. Also of note is the far-flung French enclave off the coast of Africa, Mayotte; the high-end tourist resort country, Maldives; a shipping, financial and tax avoidance centre in Latin America, Panama; and an ex-Soviet country which had previously pretended the problem did not exist; Belarus. And Russia. And another large Latin American country, Chile.
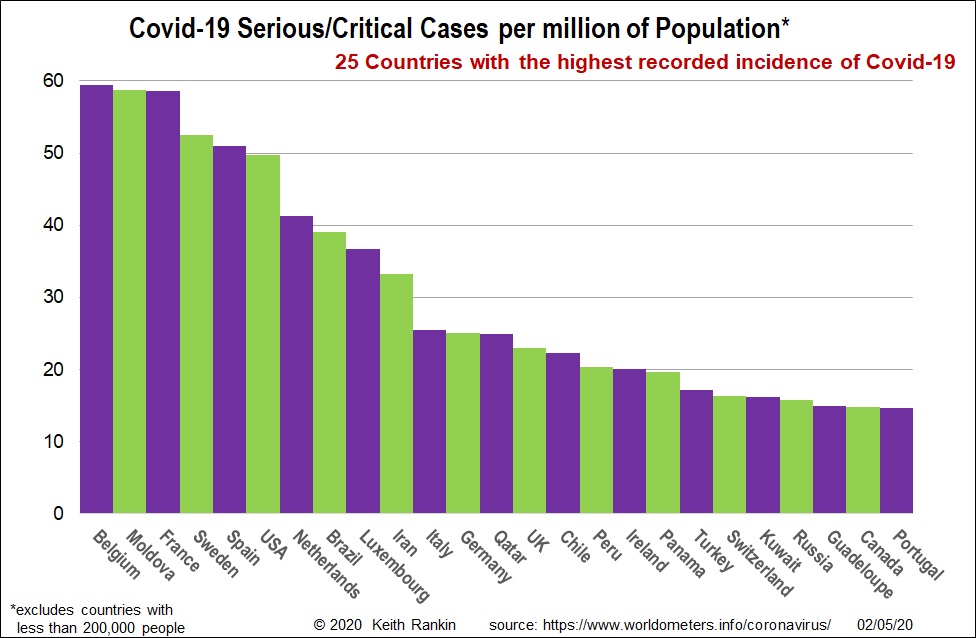
Here we see the incidence of Covid19 victims in hospital, classified as serious or critical. This is a good ‘flow’ measure of recent cases; contrast total cases and total deaths for which in many countries the data are now dominated by earlier cases. For this chart, I have excluded countries with less than 200,000 people.
Again we see the dominance of the usual suspects. Moldova, however, makes an unexpected appearance, suggesting an outbreak previously disguised by low testing. Indeed there are some other Eastern European countries that will probably appear on these charts if I repeat them next week.
Iran – an established Covid19 country – shows up here, suggesting that both its case count and death count are underreported. Brazil also shows up strongly, reflecting its status as a country that has underplayed Covid19. And Guadeloupe is a French outpost in the Caribbean, a region with a high Covid19 caseload, especially among the smallest Dutch, French and British outposts there. A number of the countries excluded because they are too small are in the Caribbean.
Finally, Canada is a country that features in all three charts. I am concerned for Canada. I was travelling through Canada at this time last year, and am somewhat distressed by Canada’s similar to the USA inability to manage the pandemic in time. Quebec and Ontario in particular reflect the high incidence of Covid19 in the northeast of the United States.