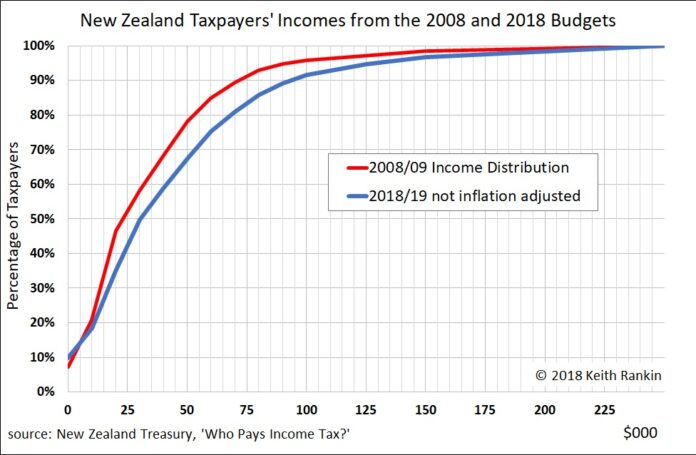
Median income: $30,000. Graph by Keith Rankin.
We often hear that the average annual wage in New Zealand is around $55,000; slightly more than $1,000 gross per week. This is misleading, it is the average for people in regular fulltime employment.
This month’s chart shows incomes as understood by Inland Revenue. The data includes “New Zealand Superannuation and major social welfare benefits, but excludes ACC levies, Working for Families and Independent Earner tax credits” (and excludes Accommodation Supplements).
The included benefits, at least for Inland Revenue accounting purposes, are grossed up to make them comparable to wages. Thus the data include self-employed people, casually employed people, students and beneficiaries; people who work variable paid hours.
Ten percent of taxpayers now declare zero (or less) income; many of these will be people claiming business losses to offset salary or rental income. The intent of running a landlording enterprise or a business at a loss is almost certainly to avoid paying income tax, and being liable for other tax-like payments such as Child Support.
The most common (modal) income bracket is between $10,000 and $20,000. This is the income bracket of most beneficiaries, including superannuitants and tertiary students.
The median taxable income (50th percentile) is $30,000; up from $23,000 ten years ago. While this represents a 30% increase in nominal median income, after allowing for 17% inflation over those ten years, it’s a 13% real increase.
Median taxable real incomes have increased on average just over 1% per year, from one very low figure to another very low figure. Most of this small real income gain will be due to increased toil – more toil means both more paid hours and more onerous employer expectations per paid hour – rather than as the productivity dividend that economic growth is supposed to yield. (Though not able to be read from the chart, the average taxpayer gross income for 2018/19 comes out at $43,500, 28% higher than in 2008/09, 11% higher after accounting for inflation. The chart shows that more than 60% of income earners receive less than this average income, reflecting the high level of skew in the income distribution.)
The 90th percentile income has reached $94,000, up from $72,000. 8½ percent of taxpayers pay tax on annual incomes over $100,000, compared to 4 percent in the year to March 2009. (Actual incomes in 2008/09 will have fallen well short of Treasury projections, however, given the financial crisis that was not predicted by Treasury at the time of the 2008 Budget.)
A typical household – calculated here as two people grossing $60,000 – will net about $51,000 per year (after tax and ACC levies). After $25,000 rent, they are left $26,000 ($500 per week) to pay for everything else, and for dependents. For many, that’s 80 hours of weekly time in paid work (or being available for work, preparing for work, or travelling to work) to create a household disposable income of $500 per week (less if paying Child Support or repaying a loan).
While transfers in the form of Family Tax Credits and Accommodation Supplements help, they are withdrawn as such households increase their taxable incomes.
Many median-income households are stuck in an income trap not much above the line of financial poverty, and inside the line of time poverty.
What of below-median income households? What of those individuals disconnected from whanau? It can be no surprise that central Auckland has the feel of a third‑world city.


