CoveragePost
May 4, 2020
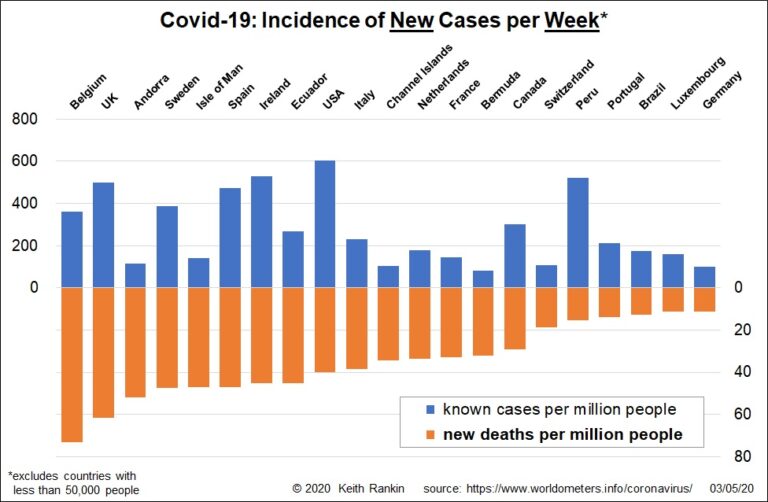
Analysis by Keith Rankin. These two charts show the total number of cases and deaths, by country, over the seven days ended 2 May 2020. In these charts a number of countries with populations below 50,000 have been omitted; countries which have shown in earlier charts. The first chart is sequenced by death rates (orange). ... <a title="Keith Rankin Chart Analysis – Covid19: New Cases and Casualties" class="read-more" href="https://eveningreport.nz/2020/05/04/keith-rankin-chart-analysis-covid19-new-cases-and-casualties/" aria-label="Read more about Keith Rankin Chart Analysis – Covid19: New Cases and Casualties">Read more</a>
CoveragePost
May 1, 2020
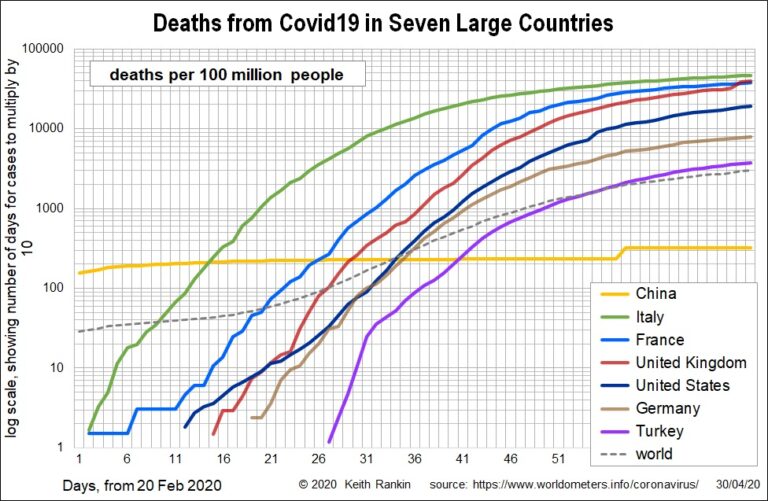
Analysis by Keith Rankin. At the end of this week, I have represented the latest summary charts with a log 10 scale, rather than the previous log 2 scale. This means that, as well as accurately showing the exponential growth pattern, the charts now emphasise ten-fold increases of Covid19 fatalities. At the top of the ... <a title="Keith Rankin Chart Analysis – Covid19: April Summary Charts" class="read-more" href="https://eveningreport.nz/2020/05/01/keith-rankin-chart-analysis-covid19-april-summary-charts/" aria-label="Read more about Keith Rankin Chart Analysis – Covid19: April Summary Charts">Read more</a>
CoveragePost
April 30, 2020
Analysis by Keith Rankin. Fact Checking On Mondays – or Tuesdays after public holidays – National Radio’s Kathryn Ryan runs a session called ‘Political Commentators’. On 28 April, from the right was regular commentator Matthew Hooton. From the left was Neal Jones who is listed as: “Chief of Staff to Labour Leader Jacinda Ardern, and prior ... <a title="Keith Rankin Analysis – Universal Income Flat Tax: the Mechanism that Makes the Necessary Possible" class="read-more" href="https://eveningreport.nz/2020/04/30/keith-rankin-analysis-universal-income-flat-tax-the-mechanism-that-makes-the-necessary-possible/" aria-label="Read more about Keith Rankin Analysis – Universal Income Flat Tax: the Mechanism that Makes the Necessary Possible">Read more</a>
CoveragePost
April 29, 2020
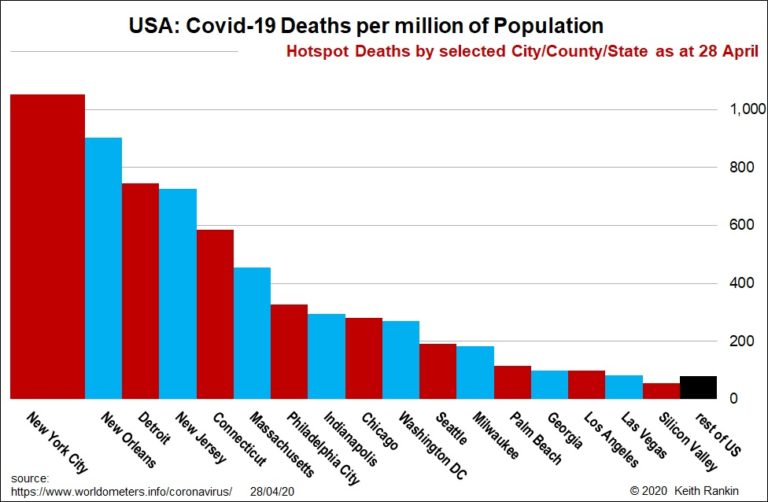
Analysis by Keith Rankin. At the end of last month I published a chart showing the main features of Covid19 deaths in the United States. Today I publish an update, which has most of the same American places. At the end of last month, New Orleans (125 deaths per million people) had the worst outbreak, ... <a title="Keith Rankin Chart Analysis – Covid19: United States’ Update" class="read-more" href="https://eveningreport.nz/2020/04/29/keith-rankin-chart-analysis-covid19-united-states-update/" aria-label="Read more about Keith Rankin Chart Analysis – Covid19: United States’ Update">Read more</a>
CoveragePost
April 28, 2020
Analysis by Keith Rankin. Predictions It is dangerous to predict how pandemics will pan out. In Covid19 by the Numbers, Anatole Kaletsky (writing for Project Syndicate on 10 March 2020) used what looked like advanced analysis to conclude that at most 750,000 outside of China would contract Covid19. (He admitted he was wide of the ... <a title="Keith Rankin Analysis – Will Covid-19 remain a First-World Disease?" class="read-more" href="https://eveningreport.nz/2020/04/28/keith-rankin-analysis-will-covid-19-remain-a-first-world-disease/" aria-label="Read more about Keith Rankin Analysis – Will Covid-19 remain a First-World Disease?">Read more</a>
CoveragePost
April 24, 2020
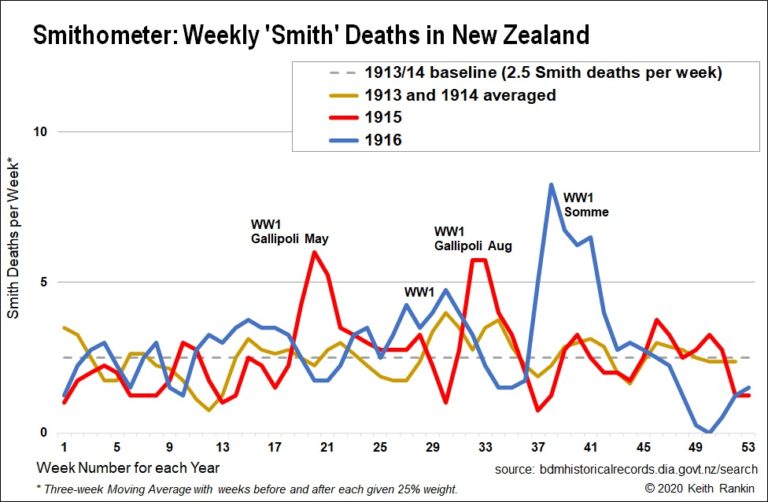
Analysis by Keith Rankin. Today’s Anzac Day Smithometer Chart shows the fatal impact in New Zealand of World War 1 battles at Gallipoli and on the Somme in France. (Earlier this week the Smithometer showed the impact of 1917 WW1 battles in Belgium – Messines and Passchendaele – and the dramatic, though short-lived, impact of ... <a title="Keith Rankin’s Chart Analysis – Smithometer: New Zealand’s World War 1 Mortality Peaks 1915-16" class="read-more" href="https://eveningreport.nz/2020/04/24/keith-rankins-chart-analysis-smithometer-new-zealands-world-war-1-mortality-peaks-1915-16/" aria-label="Read more about Keith Rankin’s Chart Analysis – Smithometer: New Zealand’s World War 1 Mortality Peaks 1915-16">Read more</a>
CoveragePost
April 23, 2020
Analysis by Keith Rankin. The System – The Whole Good systemic behaviour is acting for the good of all, not by making altruistic sacrifices but by following the golden rule (“behave towards others as you would have them behave towards you”). Or put another way, by acting to strengthen the whole, in the process we ... <a title="Keith Rankin Analysis – Systemic Behaviour, and the Challenges of the 2020s" class="read-more" href="https://eveningreport.nz/2020/04/23/keith-rankin-analysis-systemic-behaviour-and-the-challenges-of-the-2020s/" aria-label="Read more about Keith Rankin Analysis – Systemic Behaviour, and the Challenges of the 2020s">Read more</a>
CoveragePost
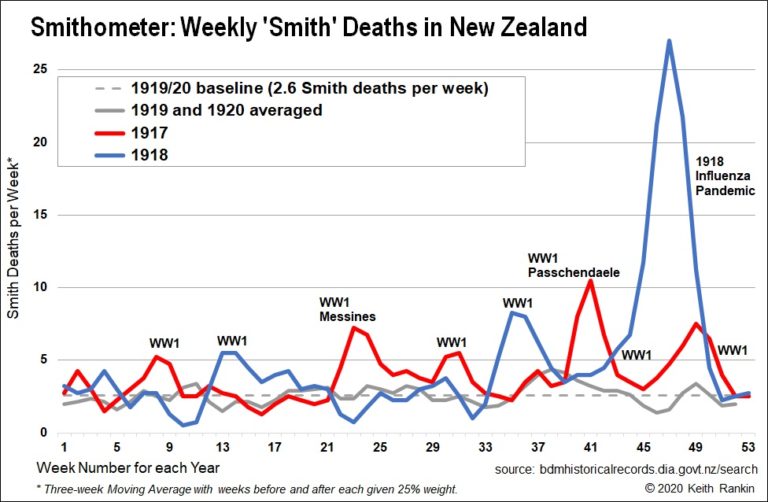
April 21, 2020
Analysis by Keith Rankin Today’s chart looks back to the years 1917 to 1920, using a sampling device I call the ‘Smithometer’. I have counted the weekly deaths of all people named Smith, from the beginning of 1917 to the end of 1920. At that time New Zealand was a country of 1.2 million people. ... <a title="Keith Rankin’s Chart Analysis – The Smithometer: New Zealand’s mortality during the 1918 Influenza Pandemic" class="read-more" href="https://eveningreport.nz/2020/04/21/keith-rankins-chart-analysis-the-smithometer-new-zealands-mortality-during-the-1918-influenza-pandemic/" aria-label="Read more about Keith Rankin’s Chart Analysis – The Smithometer: New Zealand’s mortality during the 1918 Influenza Pandemic">Read more</a>
CoveragePost
April 17, 2020
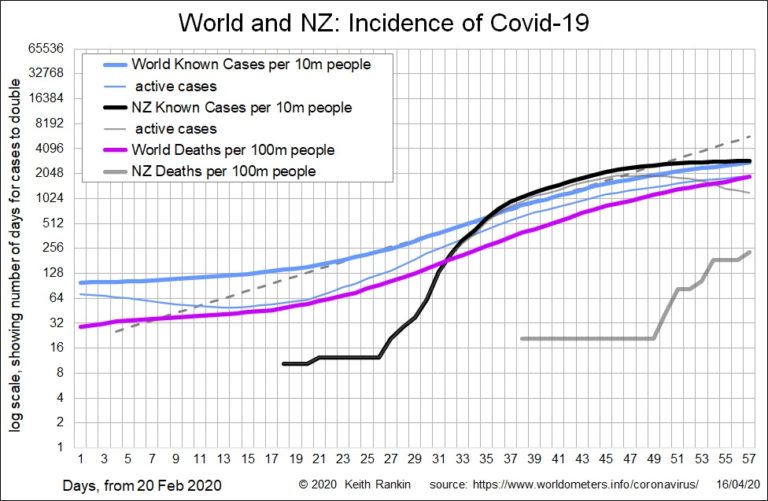
Analysis by Keith Rankin Today’s first chart looks at death rates for six major countries. We see that Spain has overtaken Italy, and that France and United Kingdom are likely to catch up with these in a week. We also note that United Kingdom death rates, as reported have been understated; these are basically hospital ... <a title="Keith Rankin’s Chart Analysis – Covid19: Weekly Summary Charts" class="read-more" href="https://eveningreport.nz/2020/04/17/keith-rankins-chart-analysis-covid19-weekly-summary-charts/" aria-label="Read more about Keith Rankin’s Chart Analysis – Covid19: Weekly Summary Charts">Read more</a>
CoveragePost
April 16, 2020
Analysis by Keith Rankin. I should be at Iguaçu Falls today, in Brazil and in Argentina. In mid-February I booked my domestic flights in these two countries, believing that the Covid19 epidemic was under control in Asia, and was unlikely to become anything like as serious anywhere else in the world, least of all in ... <a title="Keith Rankin Analysis – ‘Europia’ and the Spread of Covid19" class="read-more" href="https://eveningreport.nz/2020/04/16/keith-rankin-analysis-europia-and-the-spread-of-covid19/" aria-label="Read more about Keith Rankin Analysis – ‘Europia’ and the Spread of Covid19">Read more</a>
CoveragePost
April 15, 2020
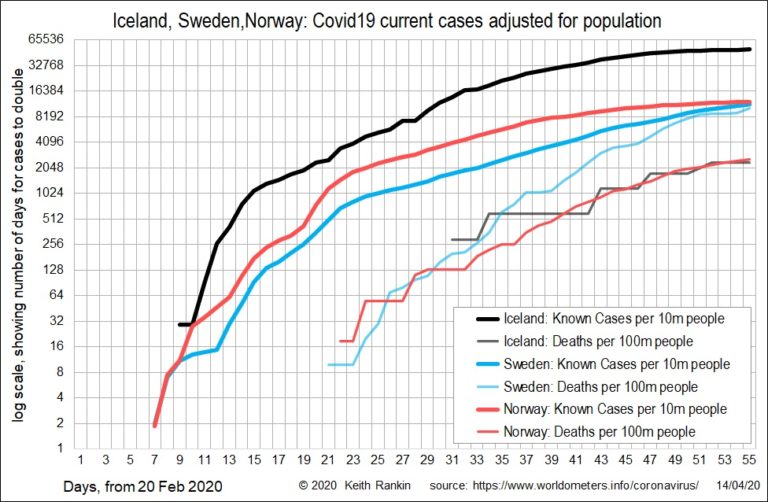
Analysis by Keith Rankin Today’s first chart looks at three Nordic countries: Iceland, Norway and Sweden. These give us a basis for analysis of underreporting of Covid19, in the main due to limited testing. Yesterday, Norway was shown as a high incidence ‘recovering country’, even though it was less recovering than South Korea. Iceland, however, ... <a title="Keith Rankin’s Chart Analysis – Covid19: Nordic Comparisons" class="read-more" href="https://eveningreport.nz/2020/04/15/keith-rankins-chart-analysis-covid19-nordic-comparisons/" aria-label="Read more about Keith Rankin’s Chart Analysis – Covid19: Nordic Comparisons">Read more</a>
CoveragePost
April 14, 2020
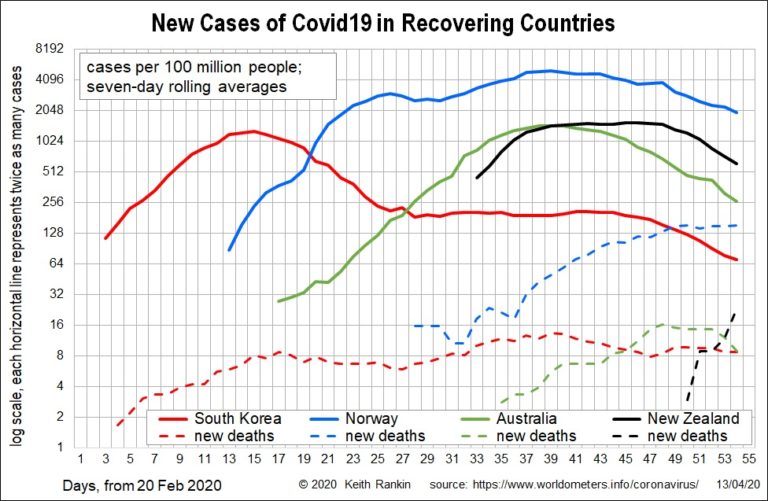
Today’s chart looks at four countries recovering from Covid19: South Korea, Norway, Australia and New Zealand. Except for us (NZ), the other countries started early and are on the ‘finishing straight’ or thereabouts. Note that this chart uses a smoothing technique; seven-day rolling averages. Thus, for each day shown, the data value represents the average ... <a title="Keith Rankin’s Chart Analysis – Recovering from Covid19" class="read-more" href="https://eveningreport.nz/2020/04/14/keith-rankins-chart-analysis-recovering-from-covid19/" aria-label="Read more about Keith Rankin’s Chart Analysis – Recovering from Covid19">Read more</a>