
Analysis by Keith Rankin.
Role: Economic historian.
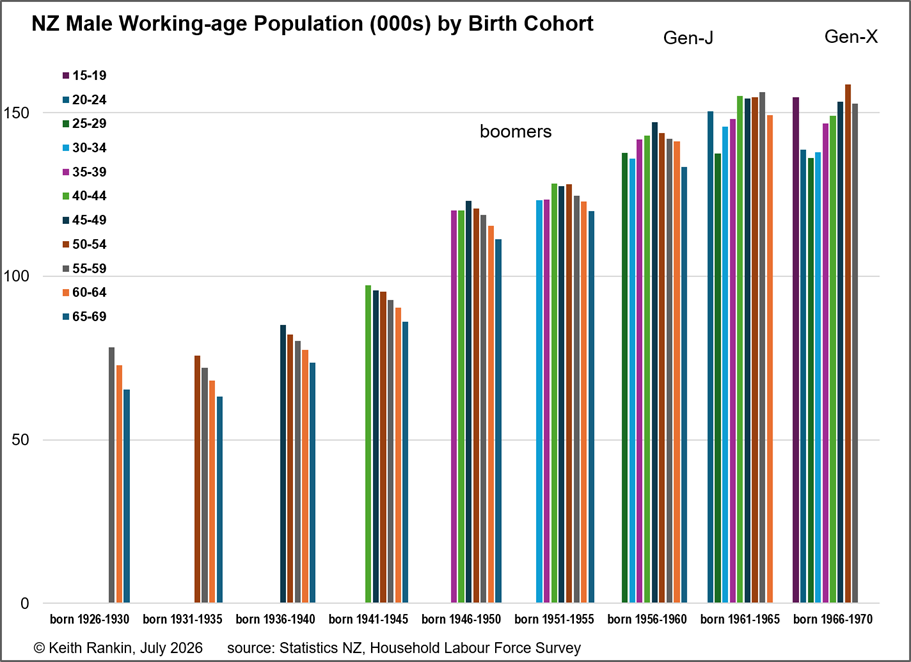
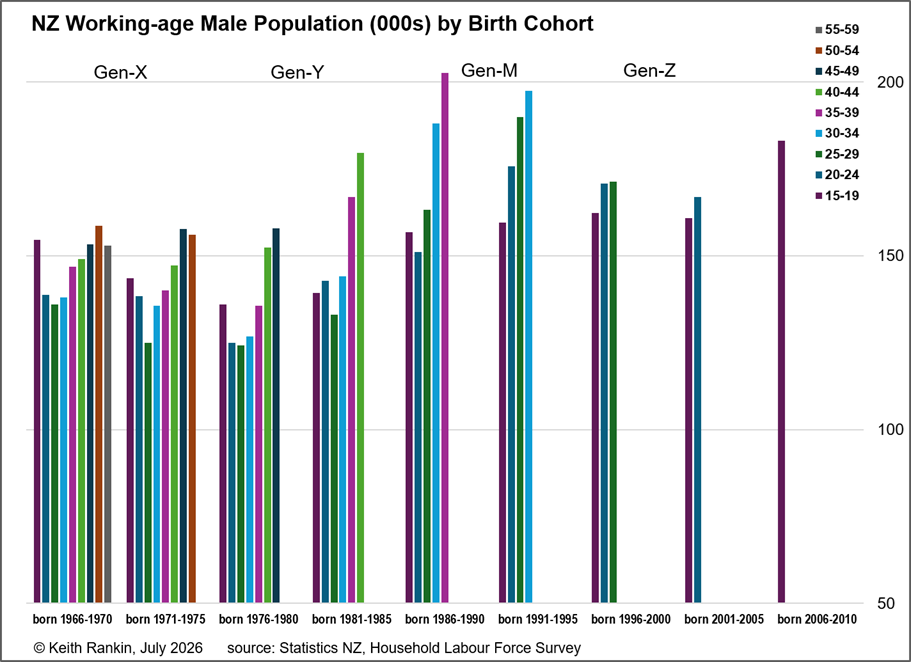
Keith Rankin, 8 July 2026 – Earlier I published two charts showing the demographic changes, from 1986 to 2026, in the female working-age population. See my Growth of New Zealand’s Working Age Female Population. These charts were organised around different birth cohorts; meaning people born in different half-decades from 1926-1930, through to 2006-2010.
Below are the equivalent charts for the male population; generally showing, compared to women, lower numbers of older men and more younger men.
About the writer:
Keith Rankin (keith at rankin dot nz), trained as an economic historian, is a retired lecturer in Economics and Statistics. He lives in Auckland, New Zealand.