
Analysis by Keith Rankin.
Role: Economic historian.
Keith Rankin, 8 July 2026 – The charts below look at women born from the 1920s to the 2000s. The charts show the sizes of the different generations (strictly ‘birth cohorts’), and the impacts of international migration and mortality on those populations. The focus of the first chart is on older women. (I plan to do similar charts for men, as well.)
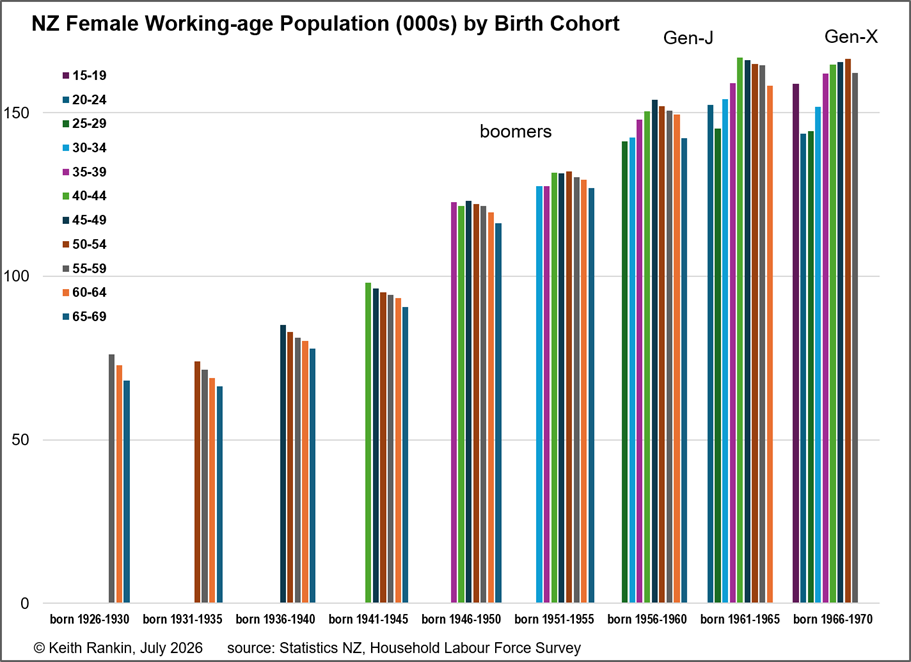
The data source is the Household Labour Force Survey (HLFS); the data run from early 1986 to early 2026. We can start by simply look at growing sizes of each birth cohort, with the 1931-1935 birth cohort (born during the Great Depression) being the smallest; it is this small birth-cohort (now in their early 90s) which is at present dying the most. Since the early 1930s, there has been a steady and significant increase in birth numbers, up to the 1961-1965 birth group.
In the chart above we see women of older working-age age groups. So, within each group, we see attrition through mortality. We note that death-attrition is more apparent for the 1926-1930 cohort than for subsequent cohorts (or at least up to birth cohort 1951-1955). For cohorts born before 1946, we note that death-attrition begins from about age 45.
With ‘boomers’ (born between 1946 and 1955), we see people in their 30s in the 1980s; and for the first time on this chart, a greater upwards impact from net immigration than the downwards impact of attrition. The number of people born in the early 1950s living in New Zealand has been boosted by net immigration, including New Zealand born people returning from overseas. Overall, the numbers of women living in New Zealand who were born in the early 1950s has barely changed since 1986.
Based on births in New Zealand – NZ-born people substantially dominated the population aged under 25 in the previous century – the early 1960s’ birth cohort was the most populous in New Zealand in, say, the year 2000. (Gen-J means ‘Generation Jones’, reflecting television culture; a popular American moniker for those born in the late 1950s and early 1960s.)
If we look at all those born after 1955, we see something of a ‘die-off’ – still small, but nevertheless significant – for the most recent data (data for the population in March 1986). This reflects the Covid and post-Covid years, and is alarming in the sense that in this chart it is for people aged under 70. We see a general pattern of population attrition after age 50, though for Gen-X that is outweighed by the impact of immigration in the 2010s.
For Gen-X we see what looks like a substantial OE (‘overseas experience’) population-hollowing effect for people aged 20 to 34. (In the HLFS dataset, we don’t have the data to show the extent of this for earlier generations.) Though, it seems likely that the high population born 1966-1970 has been boosted by substantial immigration this century of overseas-born people. Many New Zealand born Gen-Xers continue to live overseas.
The second chart shows the younger generations, starting with Gen-X.
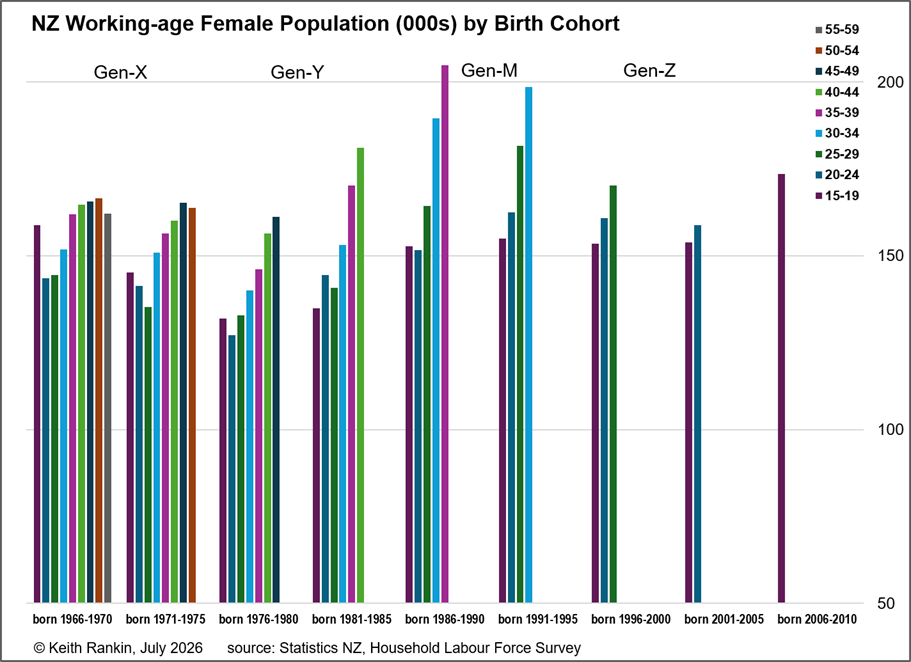
In this chart, the birth cohorts are of broadly similar size – or at least were of similar size as children; look at the 15-19 age group, the purple column. The exception is the baby-bust (Gen-Y) generation, born 1976 to 1985. We might note that this initially-depleted generation had been relatively favoured compared to the generation before and the generation after. (This is in line with the Easterlin hypothesis: “the size of the cohort is a critical determinant of how easy it is to get a good job; a small cohort means less competition”.) Many of the familiar faces we see in the visual media, and in Parliament, are from this ‘Jacinda’ generation, essentially now in their forties. (Nicola Willis was born in 1981, eight months after Jacinda Ardern.) We see the young-adult hollowing impact of ‘OE’ becoming substantially less for people born after 1975; typically they were having shorter overseas experiences as young adults than previous generations, and had good employment options in New Zealand in the early 2000s.
Birth rates were back up after 1985 – the ‘baby blip’, so millennials (Gen-M) could easily have been called the ‘baby-blippers’ or just ‘blippers’. Then, teenage populations in New Zealand were very stable for generations born from 1986 to 2005.
The most dramatic feature we see for cohorts born after 1980 is the impact of immigration. In particular we see the huge increases, from immigration, in the numbers of women aged 30 to 44. We can be certain that there have also been similar increases in New Zealand of overseas-born women now in their twenties; but these increases have been offset by huge numbers of young New Zealand citizens departing, ‘permanently’ at least for now.
One final quite dramatic feature in this second chart is the huge increase in the size of New Zealand’s teenage population. While this is partly a result of more immigrants in 2022 to 2024 being whole families, it is also a reflection of higher birth rates in New Zealand for overseas-born women. Thus the change in the ‘look’ of New Zealand’s youth, especially pronounced in places like West Auckland, reflects a mix of both young immigrants and higher rates of New Zealand born children to people of Pacific and Asian ethnicities; to people whose parents and grandparents were, for the most part, new New Zealanders.
A ‘Westie’ myself, I welcome these ‘multicultural’ demographic changes, though I am aware that some people do not like this browning of New Zealand. However, I do find it regretful that the influx of new New Zealanders is matched by the size of the New Zealand diaspora. And I wonder if New Zealand will in a few years become a net recipient of international remittance funds, as individual New Zealand resident families increasingly look to their foreign-employed children for financial support.
New Zealand is renewing its working-age population, and it is renewing its maternal population; this represents a browning of both workers and mothers. This ensures that demographic decline will be less than in those countries our elites like to compare New Zealand with; and much less depleted than countries such as those in Eastern Europe whose younger people are being ‘hoovered up’ by those countries further west.
Finally
The statistics collected by governments reflect the social preoccupations of the upper middle-classes; the managerial elites. These people tend to see the world with an immediate rear-view perspective. Thus, today New Zealand arguably collects too much information about ethnicity and gender; and too little information about people’s ages, birth-years, and birth-places.
(Countries also need a stocktake of where their people were living at age ten. This is a boundary age for the formation of national identity. A twenty-year-old foreign-born New Zealand resident has a more developed sense of New Zealand nationality if they arrived at age four, than at age sixteen; or even at age eight compared to age twelve.)
About the writer:
Keith Rankin (keith at rankin dot nz), trained as an economic historian, is a retired lecturer in Economics and Statistics. He lives in Auckland, New Zealand.