Analysis by Keith Rankin
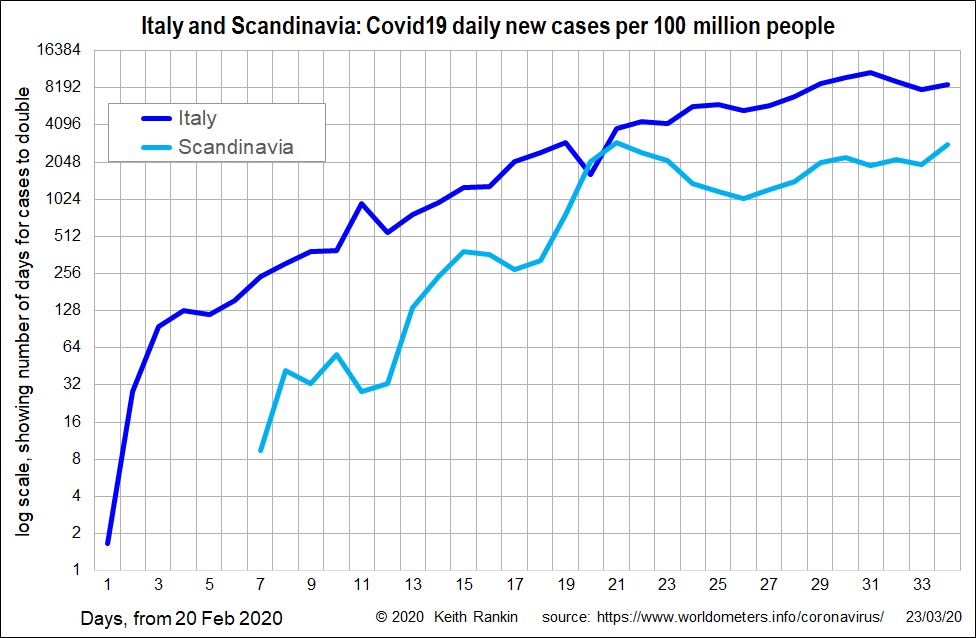
In today’s first chart, of daily new cases in Italy and Scandinavia (Norway, Sweden, Denmark), we see that, at its peak in days 20 and 21 (March 10 and 11), the incidence of known new cases in Scandinavia matched that in Italy. The difference is that new cases stabilised immediately afterwards in Scandinavia, whereas the subsequent stabilisation in Italy is at a rate four times higher (about 80 new daily cases per million people, compared to 20 per million people in Scandinavia). Hopefully yesterday’s higher daily rise in Scandinavia is a statistical ‘blip’, and not the beginning of a resurgence of new cases there.
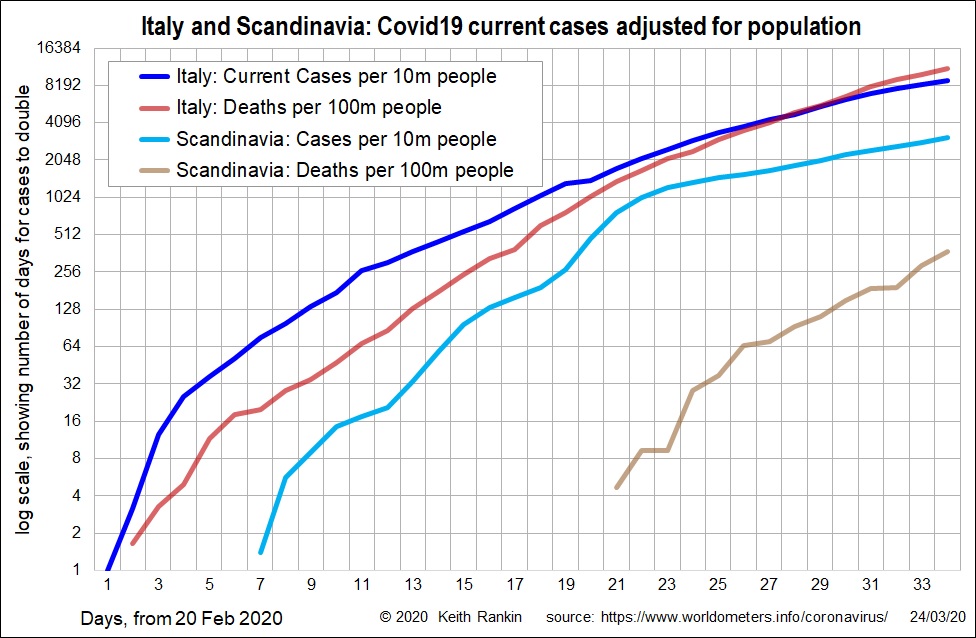
In today’s second chart, we see that both Italy and Scandinavia have moved to slower exponential growth paths for active cases (ie cases unresolved by recovery or death). Death rate growth continues at or close to the worst levels. We note that, on this type of chart, ‘normal’ exponential growth is represented by a straight upward‑sloping line. Improvement is represented by a curve getting ever‑closer to a horizontal line.
The news for Italy is hopeful, with a clear flattening of the curve most apparent for current (active) cases, but also starting to show a flattening for deaths.
Scandinavian deaths rates are considerably lower than Italian death rates. This reflects a lower incidence of Covid‑19 in Scandinavia. The lower incidence in Scandinavia presumably reflects stronger action taken sooner, relative to the start of the very sudden outbreak in Scandinavia. In Scandinavia, the plot since day 20 is flatter than before day 20. That’s good news. The bad news, however, is that the flatter plot is rising exponentially; we wish to see further reductions in the steepness of this curve.