CoveragePost
July 24, 2020
Analysis by Keith Rankin. Changing Income-Relaxation Balance as a sequence of Pie Charts On June 30 (Chart Analysis on Evening Report) I promised to elaborate on the economic policies that would underpin the new optimisation of work-life balance. I argued that economic optimisation means a balance between income and leisure, and that the Covid19 pandemic ... <a title="Keith Rankin Analysis – Optimising Work-Life Balance in the wake of Covid-19" class="read-more" href="https://eveningreport.nz/2020/07/24/keith-rankin-analysis-optimising-work-life-balance-in-the-wake-of-covid-19/" aria-label="Read more about Keith Rankin Analysis – Optimising Work-Life Balance in the wake of Covid-19">Read more</a>
CoveragePost
July 23, 2020
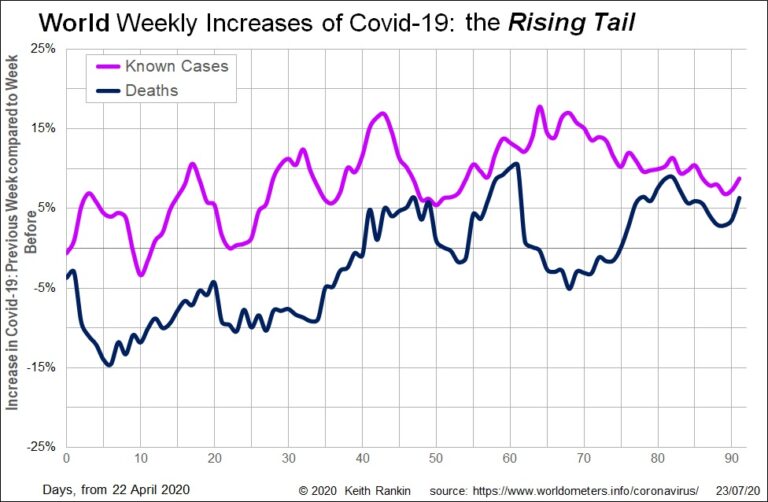
Analysis by Keith Rankin. This week’s first chart shows the huge European wave of Covid-19 in March. At its exponential peak, the chart shows world Covid19 weekly deaths increasing by 260 percent in the second week of March, compared to March’s first week. This European wave contrasts sharply with the last week of February, when ... <a title="Keith Rankin Chart Analysis – Global Covid19: European Wave and Rising Tail" class="read-more" href="https://eveningreport.nz/2020/07/23/keith-rankin-chart-analysis-global-covid19-european-wave-and-rising-tail/" aria-label="Read more about Keith Rankin Chart Analysis – Global Covid19: European Wave and Rising Tail">Read more</a>
CoveragePost
July 17, 2020
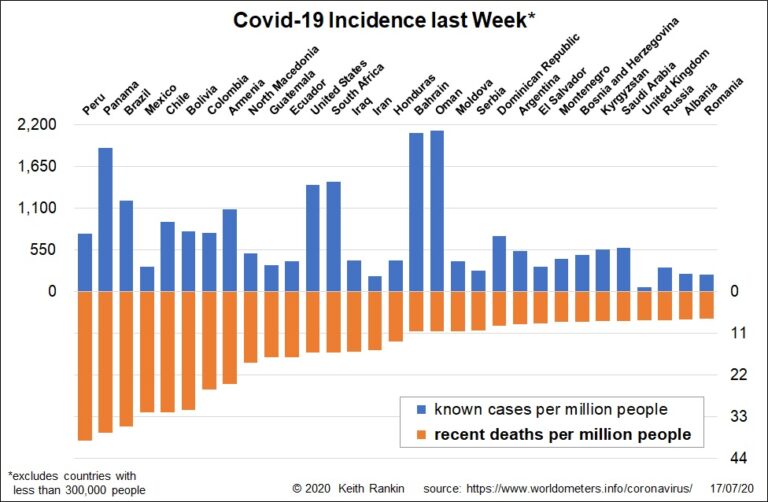
Analysis by Keith Rankin. This chart orders countries by their Covid19 death rates in the seven days to 16 July. The seven worst countries are in Latin America; all except Panama being large countries. Two other large Latin American countries (Guatemala and Ecuador) are in the top 11 for recent Covid19 deaths. Of the larger countries ... <a title="Keith Rankin Chart Analysis – Covid19: Recent Cases and Deaths" class="read-more" href="https://eveningreport.nz/2020/07/17/keith-rankin-chart-analysis-covid19-recent-cases-and-deaths/" aria-label="Read more about Keith Rankin Chart Analysis – Covid19: Recent Cases and Deaths">Read more</a>
CoveragePost
July 16, 2020
Analysis by Keith Rankin. Representative Democracy On 26 June, I attended a zoom webinar called ‘Modern politics – 20thC to MMP’, run by Auckland Libraries and Ancestry.com. The speakers were politics’ academics Grant Duncan and Toby Boraman, from Massey University. Duncan is a well-known political scientist, and Boraman is a specialist in Labour History. (An ... <a title="Keith Rankin Analysis – Universal Basic Income: Left, Right, and Centre" class="read-more" href="https://eveningreport.nz/2020/07/16/keith-rankin-analysis-universal-basic-income-left-right-and-centre/" aria-label="Read more about Keith Rankin Analysis – Universal Basic Income: Left, Right, and Centre">Read more</a>
CoveragePost
July 10, 2020
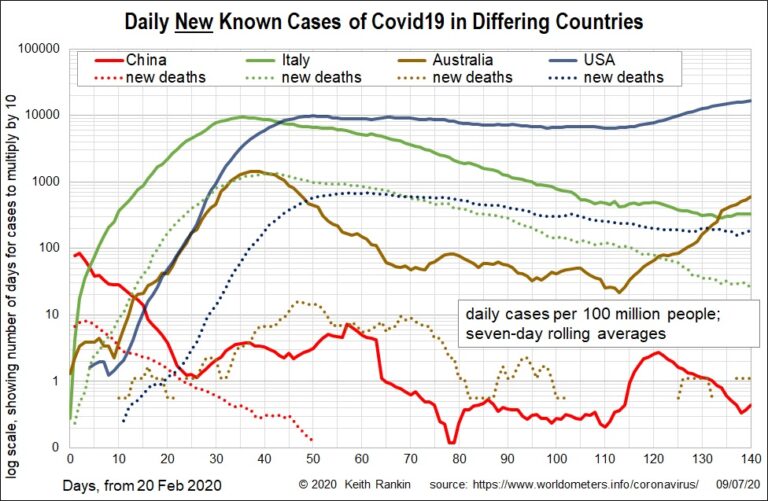
Analysis by Keith Rankin. These charts look at Covid19 incidence in China (the most important first-wave country, with a limited second wave), Italy (the lead second-wave country), and USA and Australia (second-wave countries – drawing their caseload from Europe – with limited first-wave exposure from Asia in January and February). Chart 1 shows the first-wave in ... <a title="Keith Rankin Chart Analysis – Covid19: Comparing China, Italy, USA and Australia" class="read-more" href="https://eveningreport.nz/2020/07/10/keith-rankin-chart-analysis-covid19-comparing-china-italy-usa-and-australia/" aria-label="Read more about Keith Rankin Chart Analysis – Covid19: Comparing China, Italy, USA and Australia">Read more</a>
CoveragePost
July 7, 2020
Analysis by Keith Rankin, 6 July 2020 Three Citizenships The concept of ‘citizenship’ has both general and specific meanings. The most specific and familiar I call passport citizenship. A passport citizen of a country is a person holding a passport for that country, or with unambiguous entitlement to hold such a passport. More than anything a ... <a title="Keith Rankin Analysis – Duty of Care and Economic Citizenship" class="read-more" href="https://eveningreport.nz/2020/07/07/keith-rankin-analysis-duty-of-care-and-economic-citizenship/" aria-label="Read more about Keith Rankin Analysis – Duty of Care and Economic Citizenship">Read more</a>
CoveragePost
July 2, 2020
Analysis by Keith Rankin, 2 July 2020 Socialism versus Progressive Capitalism I was disappointed that the Green Party continues to reject a distributive Universal Basic Income (UBI) in favour of a redistributive and polarising Guaranteed Minimum Income (GMI) model. GMI is the antithesis of UBI. The essence of UBI, through flattening income tax, is the creation ... <a title="Keith Rankin Analysis – Green Party Tax-Benefit Policy is not Helpful" class="read-more" href="https://eveningreport.nz/2020/07/02/keith-rankin-analysis-green-party-tax-benefit-policy-is-not-helpful/" aria-label="Read more about Keith Rankin Analysis – Green Party Tax-Benefit Policy is not Helpful">Read more</a>
CoveragePost
June 30, 2020
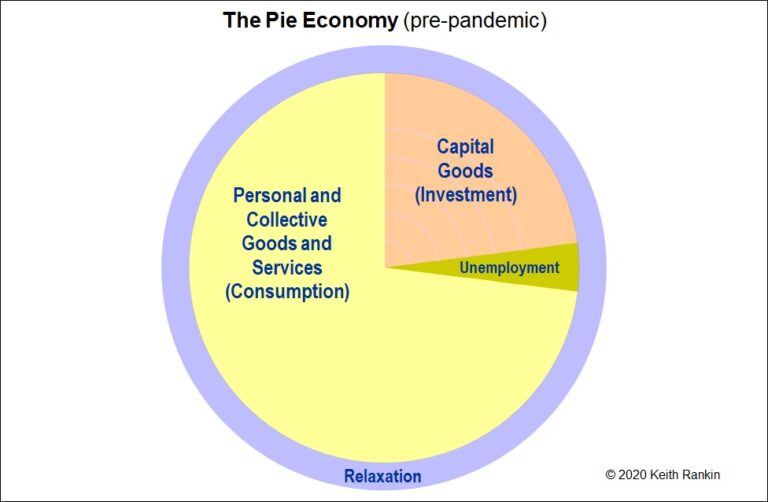
These charts tell a simple story about how the coronavirus pandemic could be a catalyst for the transition to a more sustainable economic future. Looking at Chart 1, the gross domestic product (GDP) of the economy is shown as the combination of yellow and orange. (We note that these charts represent another aspect of pie ... <a title="Keith Rankin Chart Analysis – Pandemic as a Catalyst for a New Economic Normal" class="read-more" href="https://eveningreport.nz/2020/06/30/keith-rankin-chart-analysis-pandemic-as-a-catalyst-for-a-new-economic-normal/" aria-label="Read more about Keith Rankin Chart Analysis – Pandemic as a Catalyst for a New Economic Normal">Read more</a>
CoveragePost
June 26, 2020
Analysis by Keith Rankin. Fundamental Magic The fundamentals of existence are difficult to explain, which is why we need to fall back on abstract ‘creators’; ie beings sufficiently abstract that they themselves do not need to be explained. Here is my big three list of origin magics that underpin our existence. One. The origin of ... <a title="Keith Rankin Analysis – Imagination, Science, and Day-to-Day Magic" class="read-more" href="https://eveningreport.nz/2020/06/26/keith-rankin-analysis-imagination-science-and-day-to-day-magic/" aria-label="Read more about Keith Rankin Analysis – Imagination, Science, and Day-to-Day Magic">Read more</a>
CoveragePost
June 25, 2020
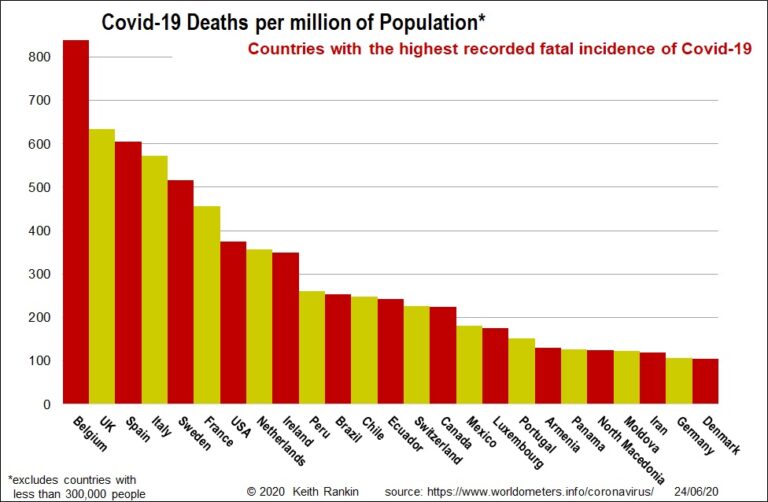
Analysis by Keith Rankin. We get a very biased picture of which countries have had the most experience of Covid19. It’s because the mainstream media almost never adjust their figures for population. So, in June, we keep hearing about United States and Brazil, but that’s mainly because they are very populous countries. It’s also because they ... <a title="Keith Rankin’s Chart Analysis – Covid19: Summary of Covid19 Incidence as of mid-June 2020" class="read-more" href="https://eveningreport.nz/2020/06/25/keith-rankins-chart-analysis-covid19-summary-of-covid19-incidence-as-of-mid-june-2020/" aria-label="Read more about Keith Rankin’s Chart Analysis – Covid19: Summary of Covid19 Incidence as of mid-June 2020">Read more</a>
CoveragePost
June 17, 2020
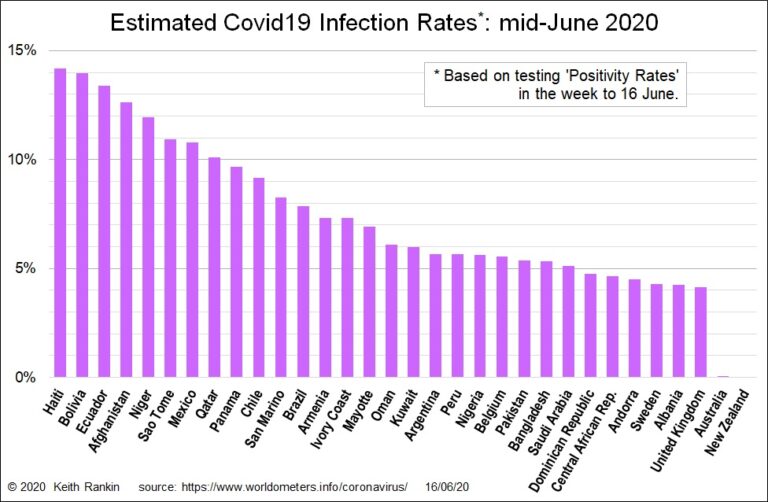
Analysis by Keith Rankin. The above chart shows my estimates for the actual infection rates of Covid19 for all countries with an (estimated) infection rate of above four percent of their population. Plus, Australia and New Zealand. The principal method of estimation is to use the testing ‘positivity rate’. If the average positivity rate over the ... <a title="Keith Rankin Chart Analysis – Covid19: Estimates of Covid19 Incidence as of mid-June 2020" class="read-more" href="https://eveningreport.nz/2020/06/17/keith-rankin-chart-analysis-covid19-estimates-of-covid19-incidence-as-of-mid-june-2020/" aria-label="Read more about Keith Rankin Chart Analysis – Covid19: Estimates of Covid19 Incidence as of mid-June 2020">Read more</a>
CoveragePost
June 16, 2020
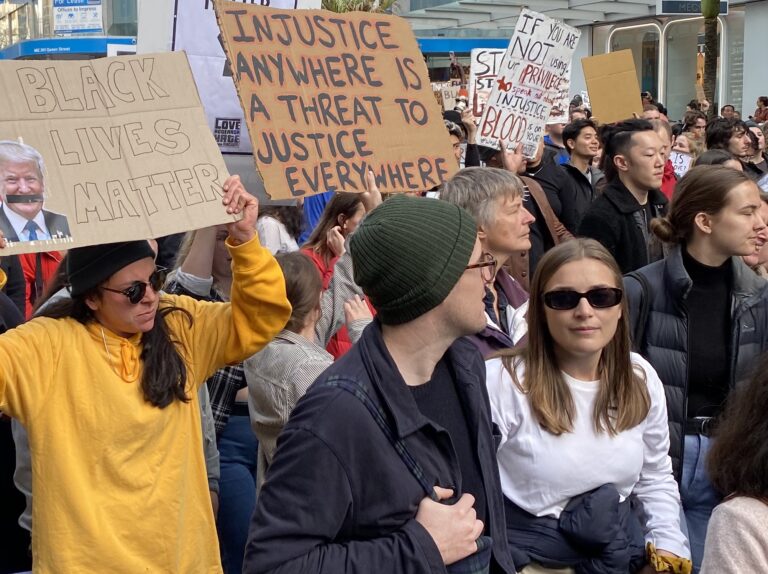
Analysis by Keith Rankin. Foreign lives matter, especially (but by no means only) when they are our foreigners. As intimated on 15 March 2019, our foreigners include all non New Zealand citizens in New Zealand, at a given point in time (the ‘present’). And our foreigners include all non New Zealand citizens normally resident in ... <a title="Keith Rankin Analysis – Foreign Lives Matter" class="read-more" href="https://eveningreport.nz/2020/06/16/keith-rankin-analysis-foreign-lives-matter/" aria-label="Read more about Keith Rankin Analysis – Foreign Lives Matter">Read more</a>