CoveragePost
May 15, 2020
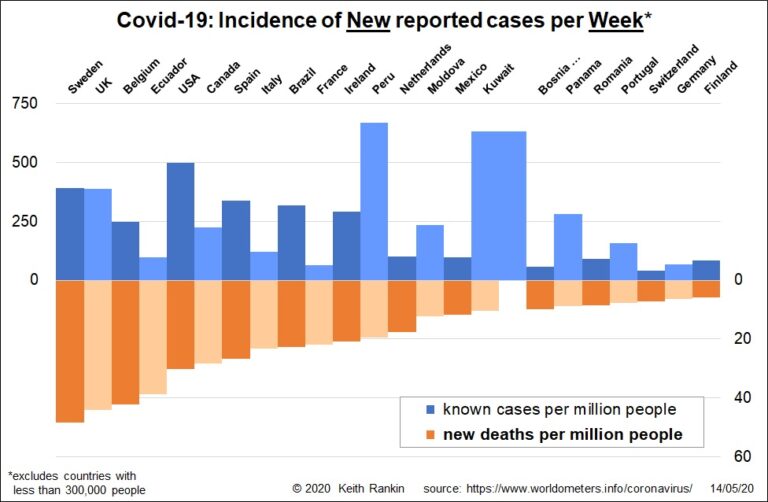
Analysis by Keith Rankin. Today’s first summary chart looks at reported Covid19 cases and deaths over the seven days to 14 May. It is sorted into a Covid19 ‘deaths league’. Sweden now leads the world for acknowledged Covid19 deaths, closely followed by United Kingdom and Belgium. While Netherlands is showing well below Sweden and Belgium, ... <a title="Keith Rankin’s Chart Analysis – Covid19: Weekly Summary" class="read-more" href="https://eveningreport.nz/2020/05/15/keith-rankins-chart-analysis-covid19-weekly-summary/" aria-label="Read more about Keith Rankin’s Chart Analysis – Covid19: Weekly Summary">Read more</a>
CoveragePost
May 12, 2020
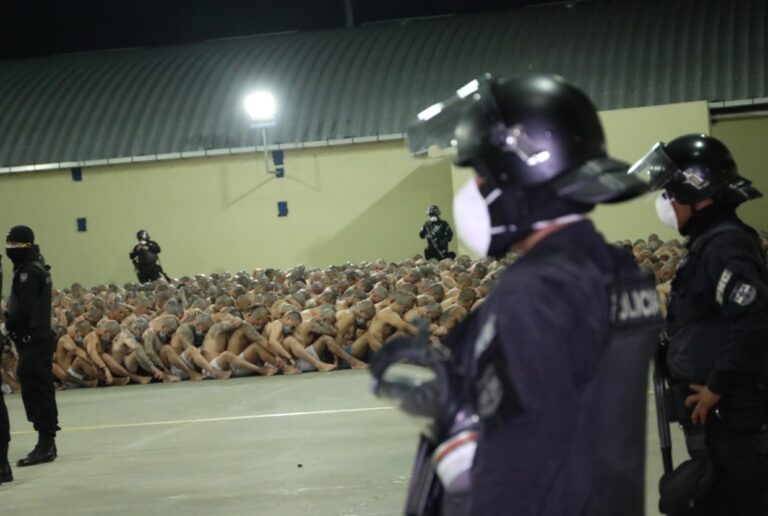
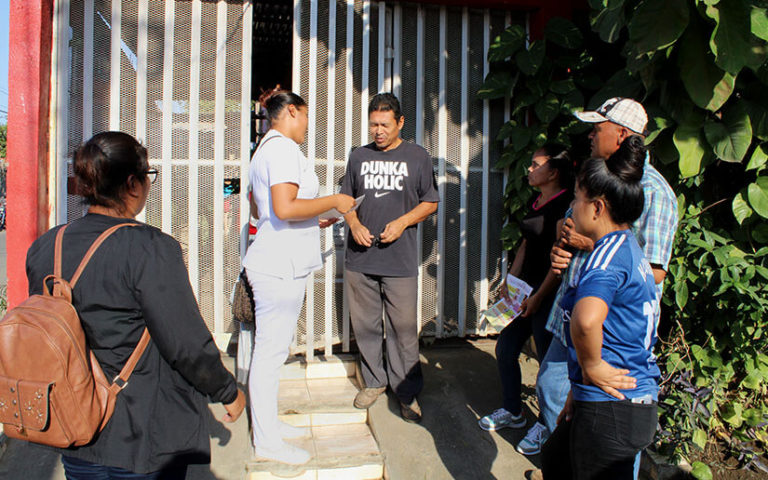
Source: Council on Hemispheric Affairs – Analysis-Reportage By Alina Duarte From Mexico City Behind that jovial image of a president who takes selfies at the U.N. and governs over social media stands a strategic ally of the United States who has little regard for human rights. The social media presence of Salvadoran President Nayib Bukele ... <a title="El Salvador: Bukele’s Heavy- Handed Response to COVID-19 Pandemic Violates Human Rights" class="read-more" href="https://eveningreport.nz/2020/05/12/el-salvador-bukeles-heavy-handed-response-to-covid-19-pandemic-violates-human-rights/" aria-label="Read more about El Salvador: Bukele’s Heavy- Handed Response to COVID-19 Pandemic Violates Human Rights">Read more</a>
CoveragePost
May 11, 2020
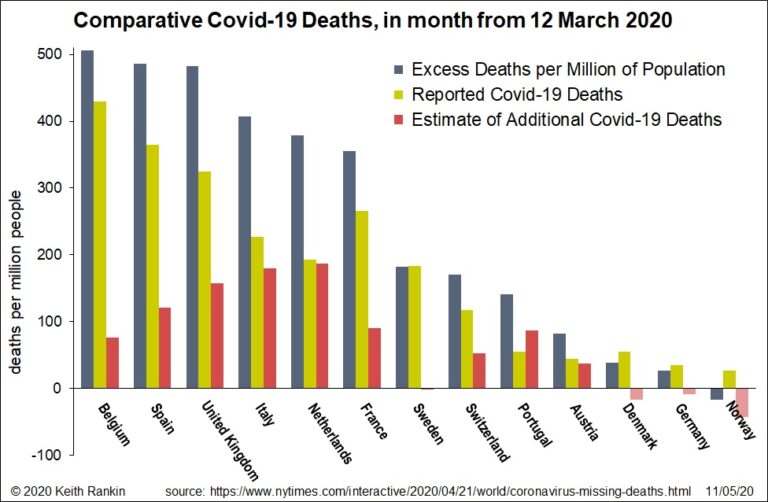
Analysis by Keith Rankin. Today’s chart shows (in grey) the estimated impact of Covid-19 on mortality rates in the selected countries. For most of these countries, the ‘excess death’ procedure provides an estimate of underreporting in underreporting countries compared to those with the most comprehensive reporting. Some of these extra deaths may have occurred as ... <a title="Keith Rankin Chart Analysis – Estimating the true death tolls from Covid19" class="read-more" href="https://eveningreport.nz/2020/05/11/keith-rankin-chart-analysis-estimating-the-true-death-tolls-from-covid19/" aria-label="Read more about Keith Rankin Chart Analysis – Estimating the true death tolls from Covid19">Read more</a>
CoveragePost
May 8, 2020
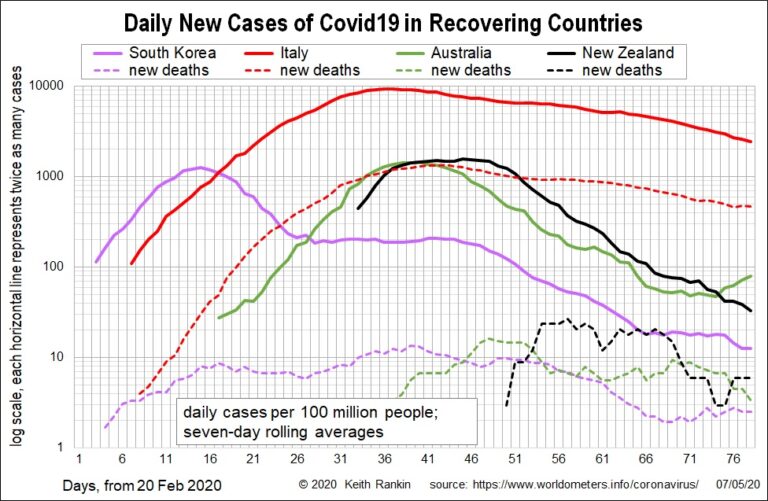
Analysis by Keith Rankin. This chart shows four recovering countries, including two of the first major outbreaks after China (South Korea and Italy), and the putative Australasian bubble. The chart shows daily average new cases, using seven-day rolling averages. Thus Italy is approaching 2000 new cases a day per 100 million people. Because Italy has ... <a title="Keith Rankin’s Chart Analysis – Covid19: Long Tail and Long Head" class="read-more" href="https://eveningreport.nz/2020/05/08/keith-rankins-chart-analysis-covid19-long-tail-and-long-head/" aria-label="Read more about Keith Rankin’s Chart Analysis – Covid19: Long Tail and Long Head">Read more</a>
CoveragePost
May 5, 2020
Analysis by Keith Rankin. Surviving the Black Flu It has been interesting for me to look back and investigate the Black Flu pandemic of 1918. The 1918 pandemic is widely regarded to have been the world’s worst pandemic since the Black Death of the late 1340s. (It was commonly known as the ‘Spanish Flu’, but this ... <a title="Keith Rankin Analysis – Smart Treatments in a Pandemic; Lessons from the Black Flu" class="read-more" href="https://eveningreport.nz/2020/05/05/keith-rankin-analysis-smart-treatments-in-a-pandemic-lessons-from-the-black-flu/" aria-label="Read more about Keith Rankin Analysis – Smart Treatments in a Pandemic; Lessons from the Black Flu">Read more</a>
CoveragePost
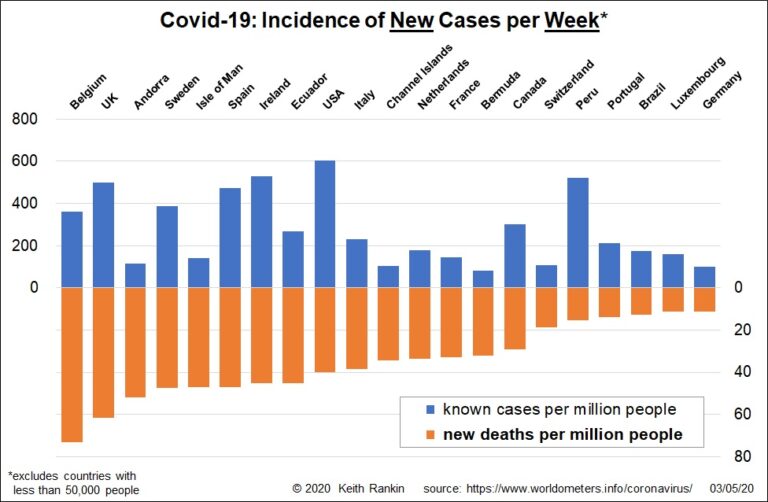
May 4, 2020
Analysis by Keith Rankin. These two charts show the total number of cases and deaths, by country, over the seven days ended 2 May 2020. In these charts a number of countries with populations below 50,000 have been omitted; countries which have shown in earlier charts. The first chart is sequenced by death rates (orange). ... <a title="Keith Rankin Chart Analysis – Covid19: New Cases and Casualties" class="read-more" href="https://eveningreport.nz/2020/05/04/keith-rankin-chart-analysis-covid19-new-cases-and-casualties/" aria-label="Read more about Keith Rankin Chart Analysis – Covid19: New Cases and Casualties">Read more</a>
CoveragePost
May 1, 2020
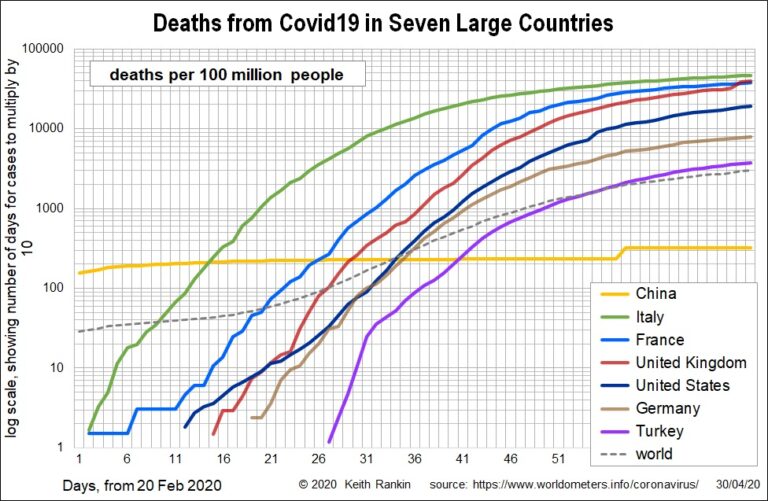
Analysis by Keith Rankin. At the end of this week, I have represented the latest summary charts with a log 10 scale, rather than the previous log 2 scale. This means that, as well as accurately showing the exponential growth pattern, the charts now emphasise ten-fold increases of Covid19 fatalities. At the top of the ... <a title="Keith Rankin Chart Analysis – Covid19: April Summary Charts" class="read-more" href="https://eveningreport.nz/2020/05/01/keith-rankin-chart-analysis-covid19-april-summary-charts/" aria-label="Read more about Keith Rankin Chart Analysis – Covid19: April Summary Charts">Read more</a>
CoveragePost
May 1, 2020
Source: Council on Hemispheric Affairs – Analysis-Reportage By John PerryFrom Masaya, Nicaragua “He’s not a doctor, I don’t think.” Trump had just finished a phone call with Juan Orlando Hernández (JOH), the de facto president of Honduras who runs a narco-state[1]. On April 30, JOH was indirectly implicated in drug and murder charges by the ... <a title="COVID-19 as Pretext for Repression in the Northern Triangle" class="read-more" href="https://eveningreport.nz/2020/05/01/covid-19-as-pretext-for-repression-in-the-northern-triangle/" aria-label="Read more about COVID-19 as Pretext for Repression in the Northern Triangle">Read more</a>
CoveragePost
April 29, 2020
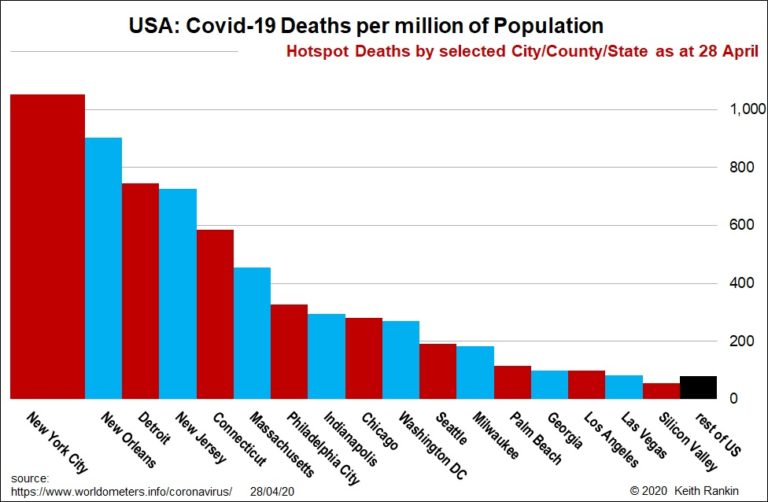
Analysis by Keith Rankin. At the end of last month I published a chart showing the main features of Covid19 deaths in the United States. Today I publish an update, which has most of the same American places. At the end of last month, New Orleans (125 deaths per million people) had the worst outbreak, ... <a title="Keith Rankin Chart Analysis – Covid19: United States’ Update" class="read-more" href="https://eveningreport.nz/2020/04/29/keith-rankin-chart-analysis-covid19-united-states-update/" aria-label="Read more about Keith Rankin Chart Analysis – Covid19: United States’ Update">Read more</a>
CoveragePost
April 28, 2020
Analysis by Keith Rankin. Predictions It is dangerous to predict how pandemics will pan out. In Covid19 by the Numbers, Anatole Kaletsky (writing for Project Syndicate on 10 March 2020) used what looked like advanced analysis to conclude that at most 750,000 outside of China would contract Covid19. (He admitted he was wide of the ... <a title="Keith Rankin Analysis – Will Covid-19 remain a First-World Disease?" class="read-more" href="https://eveningreport.nz/2020/04/28/keith-rankin-analysis-will-covid-19-remain-a-first-world-disease/" aria-label="Read more about Keith Rankin Analysis – Will Covid-19 remain a First-World Disease?">Read more</a>
CoveragePost
April 21, 2020
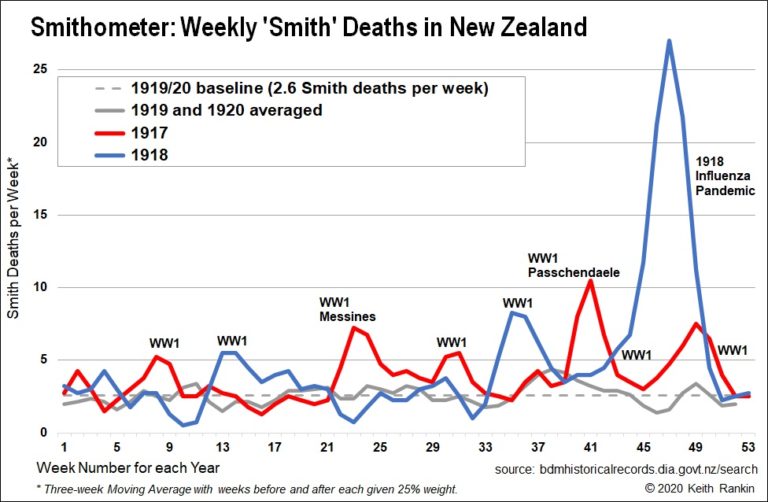
Analysis by Keith Rankin Today’s chart looks back to the years 1917 to 1920, using a sampling device I call the ‘Smithometer’. I have counted the weekly deaths of all people named Smith, from the beginning of 1917 to the end of 1920. At that time New Zealand was a country of 1.2 million people. ... <a title="Keith Rankin’s Chart Analysis – The Smithometer: New Zealand’s mortality during the 1918 Influenza Pandemic" class="read-more" href="https://eveningreport.nz/2020/04/21/keith-rankins-chart-analysis-the-smithometer-new-zealands-mortality-during-the-1918-influenza-pandemic/" aria-label="Read more about Keith Rankin’s Chart Analysis – The Smithometer: New Zealand’s mortality during the 1918 Influenza Pandemic">Read more</a>
CoveragePost
April 18, 2020
Source: Council on Hemispheric Affairs – Analysis-Reportage Support this progressive voice and be a part of it. Donate to COHA today. Click here By John Perry From Masaya, Nicaragua The right-wing opposition in Nicaragua, having failed in their attempted coup in 2018, still looks at any potential crisis as a new opportunity to attack the ... <a title="Nicaraguan Right-wing Opposition Misrepresents Government Response to the COVID-19 Pandemic" class="read-more" href="https://eveningreport.nz/2020/04/18/nicaraguan-right-wing-opposition-misrepresents-government-response-to-the-covid-19-pandemic/" aria-label="Read more about Nicaraguan Right-wing Opposition Misrepresents Government Response to the COVID-19 Pandemic">Read more</a>