
Analysis by Keith Rankin.
Role: Economic historian.
Keith Rankin, 5 October 2026 – Since 24 August, six weeks ago, the New Zealand dollar (NZD) has fallen in value by 5.3% on a weighted-average basis, and by a greater percentage against the USD and most Asian countries’ currencies.
The exchange rate mechanism is supposed to be a global mechanism of stabilising price feedback, whereby a country with an external surplus – with higher foreign-income receipts (especially exports) than foreign-income payments (especially imports) – should have a rising exchange rate. And that countries with an external deficit should have a falling exchange rate. Currencies are a ‘zero-sum game’; if some appreciate, other must depreciate in an equal and opposite way. (See my rather long essay; Feedback Economics: Stabilisation versus Escalation, Scoop 2 October 2026, for a general discussion of the interplay of economic feedback and economic policy.)
The result of this thermostatic mechanism – when it works as it should – is that countries with depreciating exchange rates, while having more inflation, become more price competitive and thereby export a bit more and import a bit less. Vice versa for countries with appreciating exchange rates. Exchange rates should stabilise at prices which confer balanced trade; minimal external surpluses across all countries, and therefore minimal external deficits across all countries.
The problem is that the mechanism – which is an excellent mechanism in theory – doesn’t work in practice. Too many countries want to have external surpluses rather than balanced trade. (If you look at tradingeconomics.com, and at the ‘current account’ column, you will see ‘green for surplus for good’ and ‘red for deficit for bad’ in the various countries’ numbers. A zero balance is good; a surplus or deficit ‘unbalance’ are equally bad. Countries which persist in having external balances in surplus for many decades are ‘successful’ trade mercantilist countries; while they practically give their stuff away, they gnaw away at international economic stability. They typically have undervalued currencies.)
In particular, currencies’ values are to an overly large extent determined by ‘financial investment’ flows. Here, we mean ‘investment’ in the financial sense of ‘saving’, not in the economic sense of ‘spending’.
Examples of external financial flows are: overseas borrowing and lending, repaying overseas loans, overseas loans being repaid, selling overseas assets and repatriating the proceeds, and selling domestic assets to foreign buyers. In New Zealand, a big contribution this year has been funds managers acquiring foreign shares and bonds and real estate on behalf of their New Zealand clients; these transactions place downward pressure on the NZD.
These financial flows – since the 1980s at least – are commonly manipulated by central banks (such as the BBNZ), with the aim in particular of maintaining or raising the price of a currency through those reserve banks posting higher interest rates. In particular, comparing two countries both with high credit ratings on government finance as assessed by the New York based credit rating agencies, the one which posts the higher interest rate gets to ‘enjoy’ high levels of ‘foreign investment’.
(This procedure amounts to an international Ponzi scheme, in that the interest and any repayments are serviced not by exports but by keeping domestic interest rates perpetually ahead of those of the other countries with similar credit ratings. New Zealand played this game for 35 years from 1985 to 2020. It has not been possible to keep playing after Covid19, given the high interest rate policies of the United States, United Kingdom, and Australia. The NZD has held up (but not risen) this decade – from 2022 to 2025 – thanks to very favourable export prices.)
The Charts
The four charts here show the changes, from 2018, between the NZD and the currencies of seven countries: South Korea, China, India, Philippines, Japan, United States, and Australia. And it shows the TWI measure (‘trade-weighted index’) which correctly displays the international price of the New Zealand dollar, measured against the 17 currencies New Zealand conducts most of its trade in.
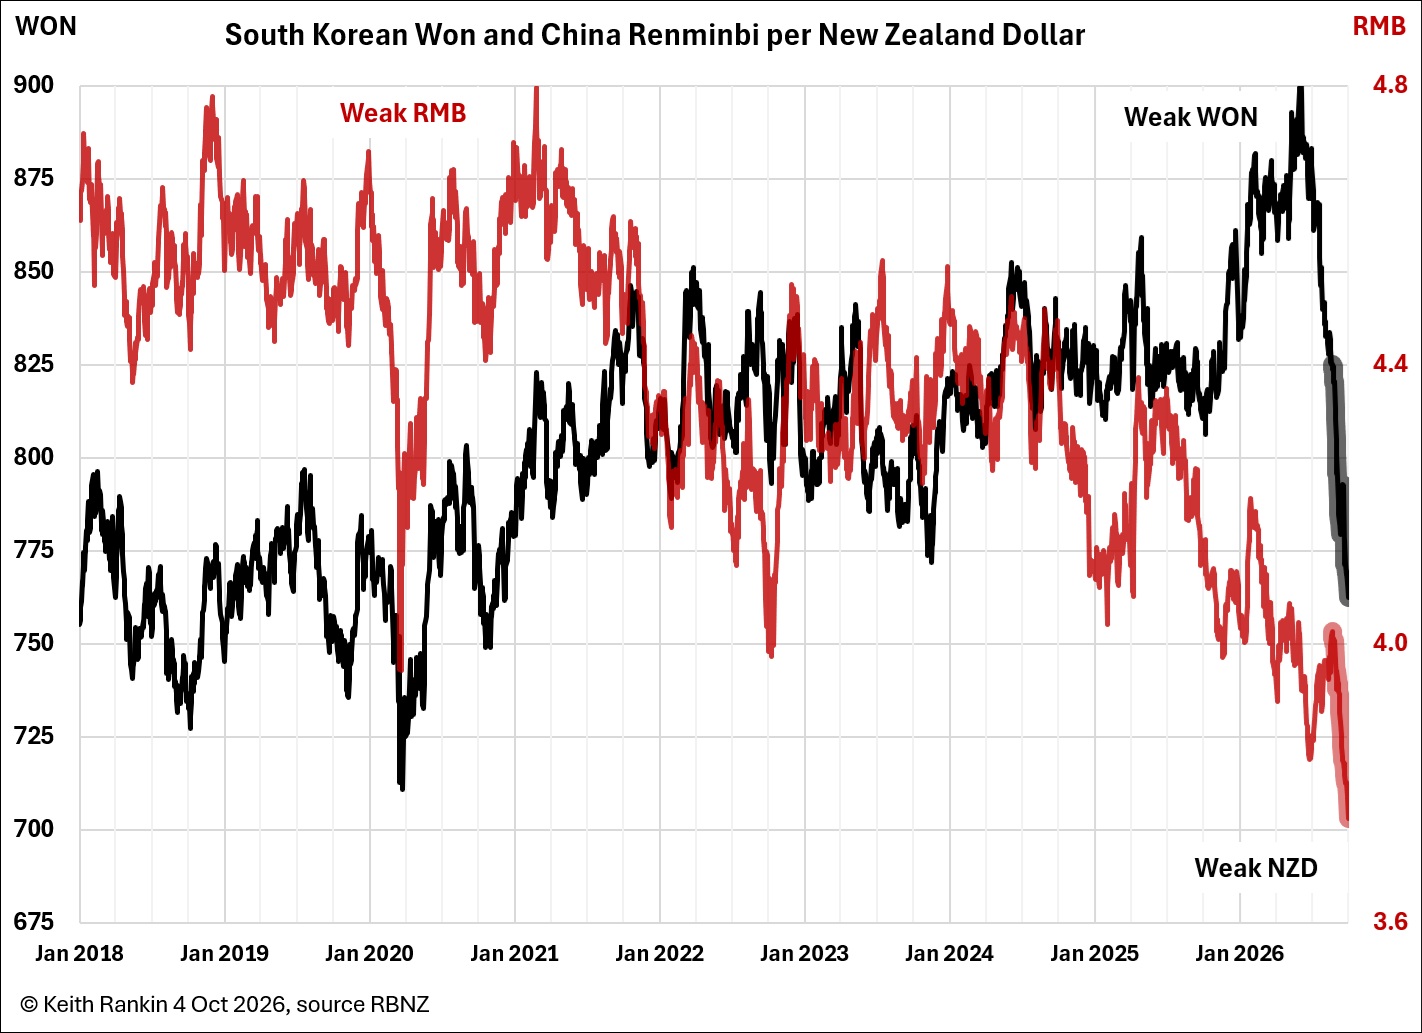
The first chart shows a strongish Korean won and a weakish Chinese renminbi in the late 2010s. Then, in the post-Covid years, there is exchange rate stability; short-term fluctuations (‘noise’) but no trends. Then from mid-2025 to mid-2026, the Korean currency fell against the NZD while the Chinese currency rose. In early 2026, the Korean won appears to have suffered from the Israel-Iran War.
Then, in very recent months, the NZD fell sharply against both of these currencies. The NZD has experienced a particularly precipitous recent decline against the Korean won; an 18% fall in three months.
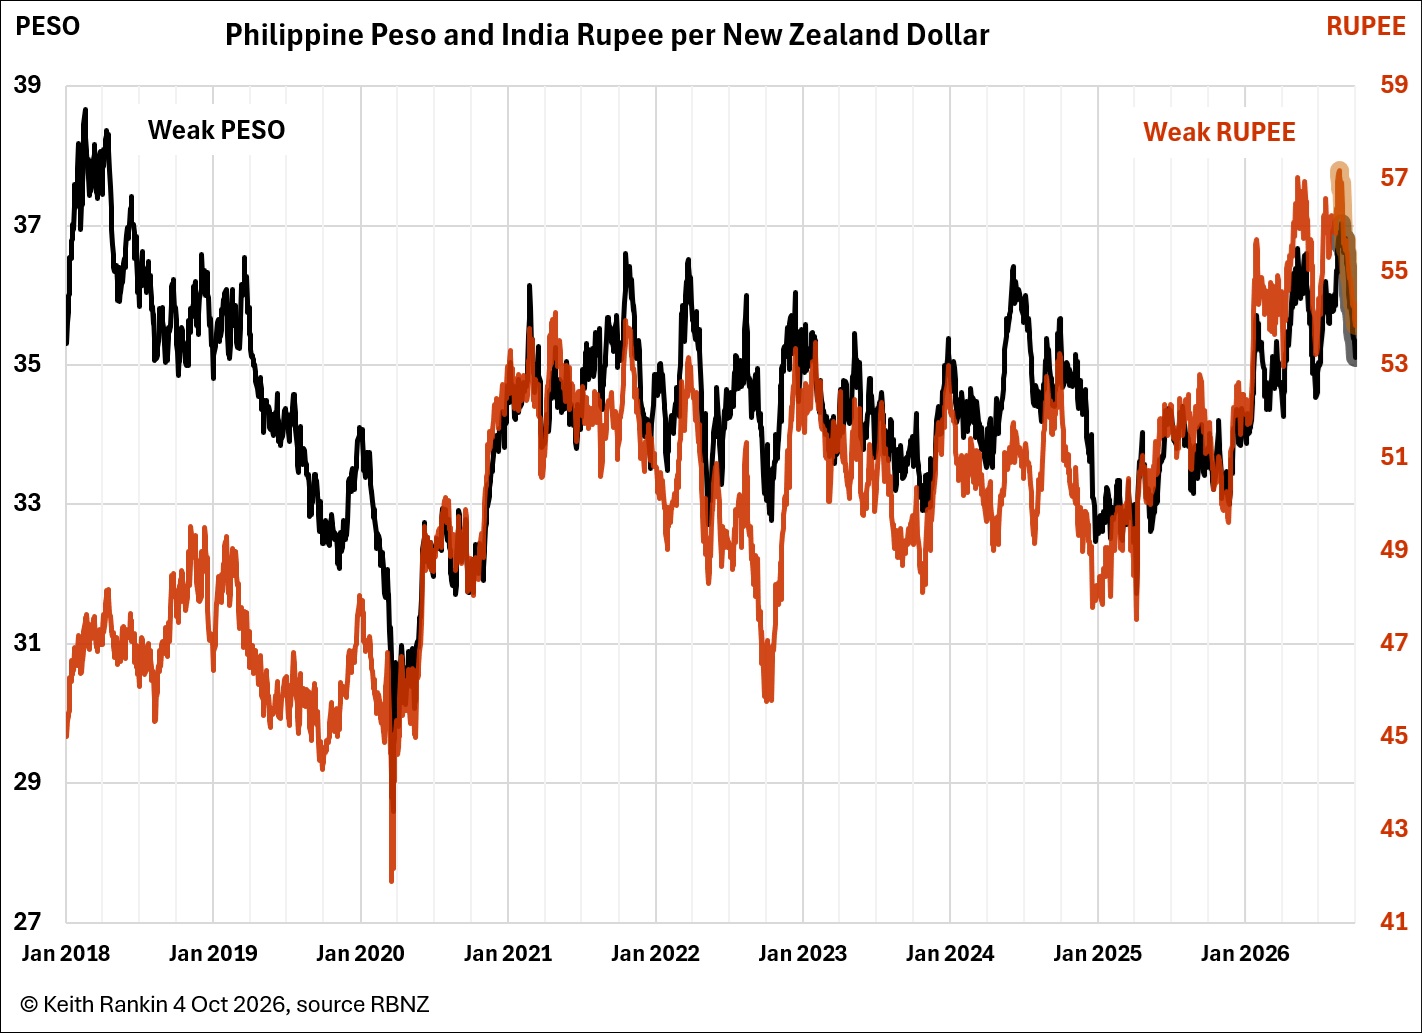
The second chart shows the Indian rupee and Philippine peso against the NZD. These are both source countries for large numbers of very new New Zealanders. Economic relations with these two countries represent an important part of New Zealand’s future. We see that from 2020, those two countries’ currencies have moved together, much as the New Zealand and Australian currencies commonly move together. We note the NZD falling five to six percent against these in the last few weeks; shifts that could be either ‘loud noise’ or the start of a bigger decline of the NZD.
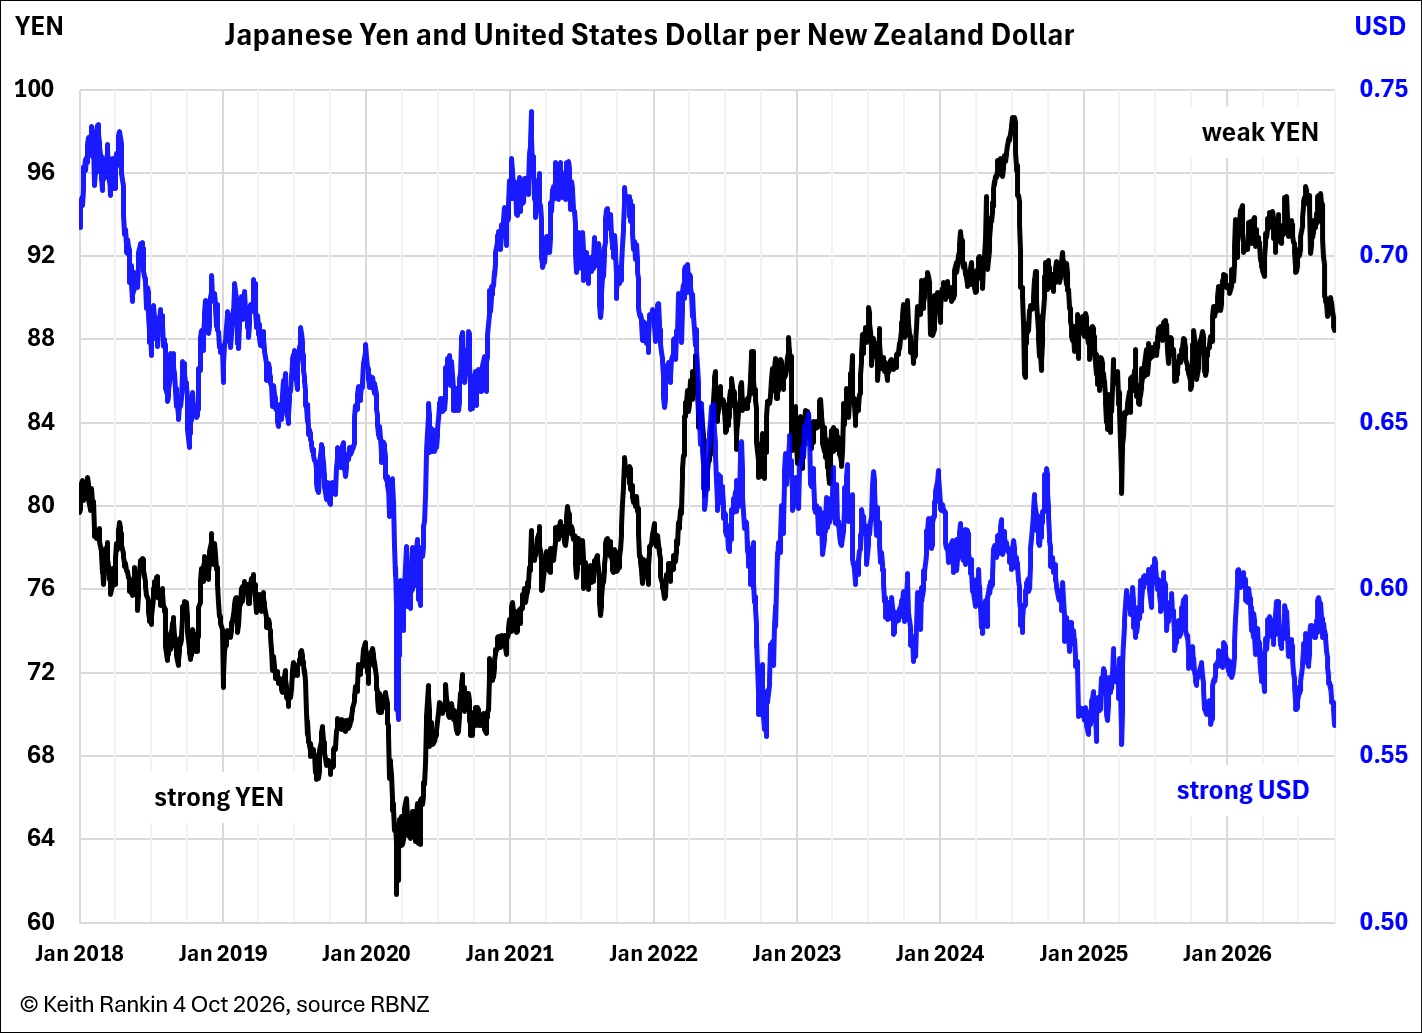
The third chart shows the Japanese Yen and United States dollar. These are the two currencies which, of late, have been ‘making waves’ (in complementary directions) in the global economy. We see that the NZD has fallen substantially against both in recent weeks, though those very recent changes do not yet show up as an unstable ‘dive’ of the NZD. The differences here reflect, among other things, perpetually low interest rates in Japan, and high post-Covid interest rates in the United States. Japan, with it’s external surpluses, should – based on the exchange-rate price mechanism –be strong and the United States should be quite weak. This fundamental relationship – theory but not observation – has been contradicted in large part by Japan’s high and increasing ownership of United States government debt.
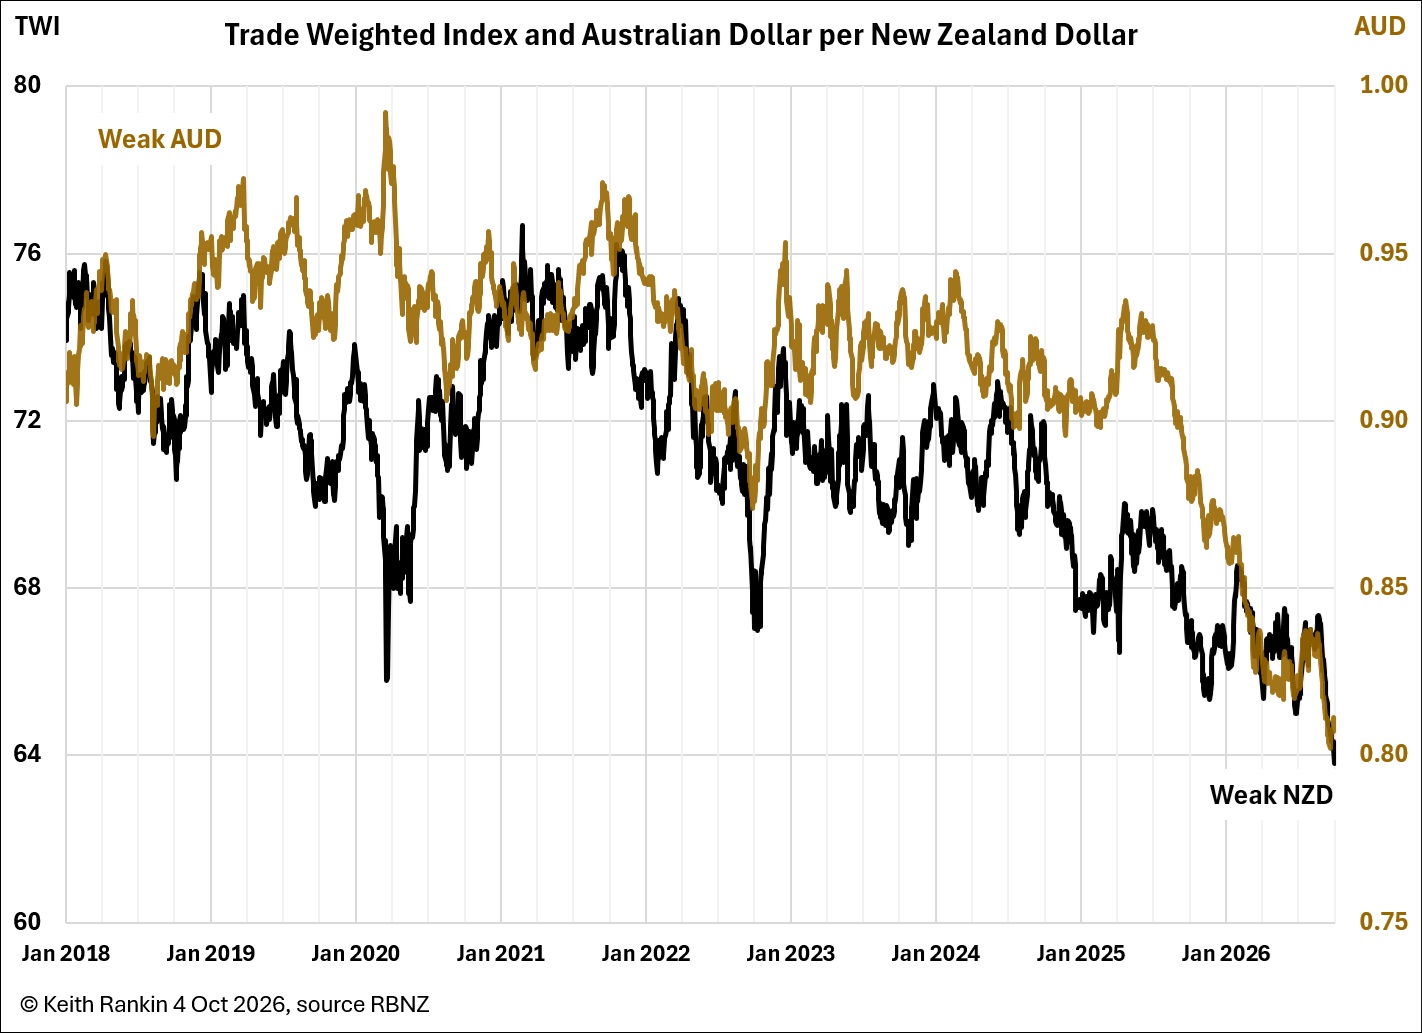
The final chart shows the New Zealand and Australia currency relationship. And it shows the TWI, which is the most accurate measure of the price of the New Zealand dollar; measured as a weighted average against 17 currencies, with the USD having the greatest weight. This chart shows that the relationship between the two southern dollars was stable from 2018 to mid-2025. And that the NZD slide against the AUD began about 15 months ago. Further, the chart shows that the overall depreciation of the New Zealand dollar began two years ago.
The declines in the last six weeks might be the start of a bigger depreciation; this is especially so in the sense that its not politically viable for the RBNZ to push interest rates up to the five-percent level which would be required for New Zealand to outcompete on interest rates the United States, the United Kingdom, and Australia, for floating international money.
Escalating Feedback
Countries’ currency movements can be destabilising – escalating – exactly the opposite of what the floating mechanism is supposed to achieve. This occurs when ‘players’ in the international ‘investment’ game base their predictions not on the economic fundamentals (ie the price of currencies in relation to countries’ international trade) but on the converse expectation that a falling currency will continue to fall. Thus, assets denominated in the falling currency will be increasingly sold; whereas, according to basic economic principles, such assets should be increasingly bought.
(It works like this with general prices and domestic inflation, too. The expectation used to be that too-high prices would fall soon enough; and too-low prices would rise soon enough. Nowadays though, we enforce monetary policies based on the opposite expectations; namely that people in countries with prices that are rising the most will expect those prices to rise even faster in the future. This new expectation – in vogue since the 1980s – is contrary to fundamental economic principles around the price mechanism.)
The Jury is Out
Is New Zealand on the verge of an extranational financial crisis? (Extranational here means ‘New Zealand versus the world’ rather than ‘New Zealand in the world’.) But we note that there’s much chatter around the world about an imminent global financial crisis, precipitated by appreciating ‘bond yields’ on the world’s debt markets as interest rates on ‘safe debt’ are becoming unsustainably high.
So, there is a very real chance that an ongoing decline of the New Zealand dollar will be an early symptom of a wider crisis. If international perceptions become that New Zealand is an increasingly marooned economy, those perceptions will escalate as capital flight takes hold. Capital flight exists when foreigners cash up their New Zealand assets, and when New Zealanders scramble to acquire foreign assets. This latter phenomenon is already clearly visible re KiwiSaver managed funds.
Still, if highly favourable export conditions persist – of if rich foreigners increasingly like the look of New Zealand precisely because it is marooned away from the world’s perceived danger spots – New Zealand may continue to appear prosperous to foreign eyes.
About the writer:
Keith Rankin (keith at rankin dot nz), trained as an economic historian, is a retired lecturer in Economics and Statistics. He lives in Auckland, New Zealand.