Analysis by Keith Rankin.
Role: Economic historian.
Keith Rankin, 18 June 2026 – The latest quarterly economic growth data were released by Statistics today. The following chart summarises eight-quarter (ie two yearly) economic growth rates from 1990. I have colour coded the data to match the political party leading the government for each period. (Shades are lighter where the data spans a change of government.)
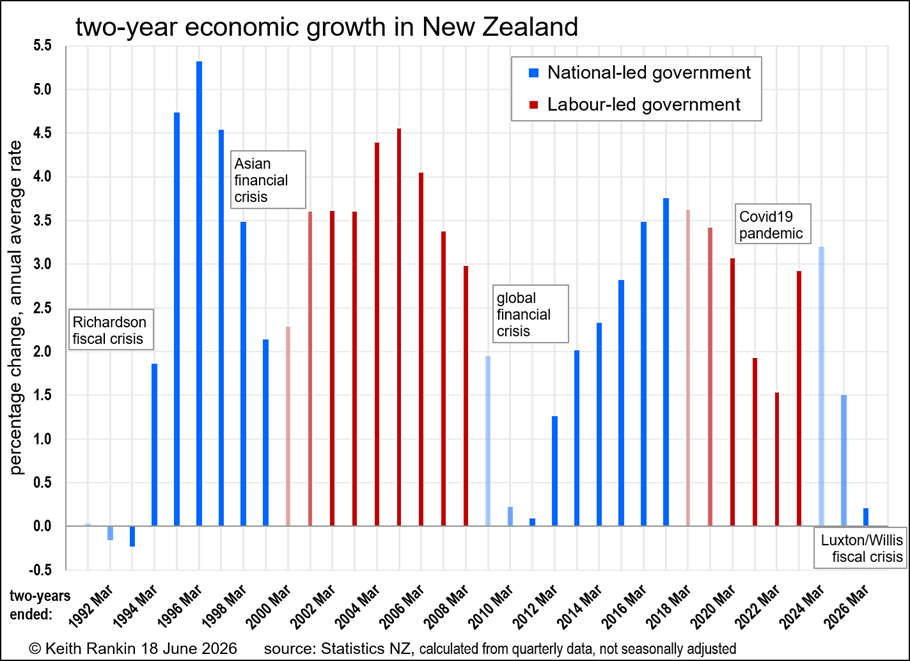
In the charted data, it is clearly possible to see the effects of two international financial crises, one pandemic, and two domestic fiscal crises. While both of the two fiscal crises are/were associated with National governments, the first ‘Richardson crisis’ followed on from the Labour-associated economic crisis linked to Roger Douglas. (The data series available only allowed me to go back to 1990.)
An important point to note is that, historically, there has generally been a significant ‘bounce-back’ of economic growth following a period of economic slowth. (There was an exceptionally large bounce-back in New Zealand in the 1930s after the Great Depression.)
The two exceptions to this bounce-back generalisation are the two growth phases preceding the two National-led domestic fiscal crises. The Richardson recession followed a period of flat economic growth from 1986. And the Luxton/Willis recession seems to have flattened what should have been a post-Covid19 bounce-back.
Recession? Or just slow growth?
Although the chart above doesn’t show a technical recession in 2025 or 2026, there has certainly been a recession, according to the latest figures. Real production GDP was $73,625 million (expressed in 2009/10 prices) in the December 2025 quarter, whereas it was $73,752 million two years earlier.
It’s a similar story of decline for the June and September quarters of 2025 (when National was in charge), compared to the same quarters of 2023 (when Labour was in charge). It means that the total GDP for the year ended March 2026 was $282.97 billion compared to $283,180 billion for the year ended March 2024. This is despite significant population growth in New Zealand between 2023 and 2025. And this is despite a markedly improving terms-of-trade; meaning a highly favourable global economic environment for New Zealand.
GDP lower than it was two years earlier is a recession. This latest recession seems to have been particularly unnecessary, occurring in otherwise unusually favourable times. Why is there so little criticism? Where is Labour’s evidence-based critique of National?
About the writer:
Keith Rankin (keith at rankin dot nz), trained as an economic historian, is a retired lecturer in Economics and Statistics. He lives in Auckland, New Zealand.