
Analysis by Keith Rankin.
Role: Economic historian.
Keith Rankin, 10 July 2026 – I note that the New Zealand ambulance service (Hato Hone St John), has experienced four days this last week of all-time record callouts. The reason is a mix of increasing numbers of middle-aged and older people, spikes in certain winter illnesses, and a possible increased incidence of chronic illnesses. (See One call every 20 seconds: Current demand for ambulances ‘unsustainable’ – St John, RNZ 10 August 2026.)
These ambulance callout data will be strongly correlated to mortality data.
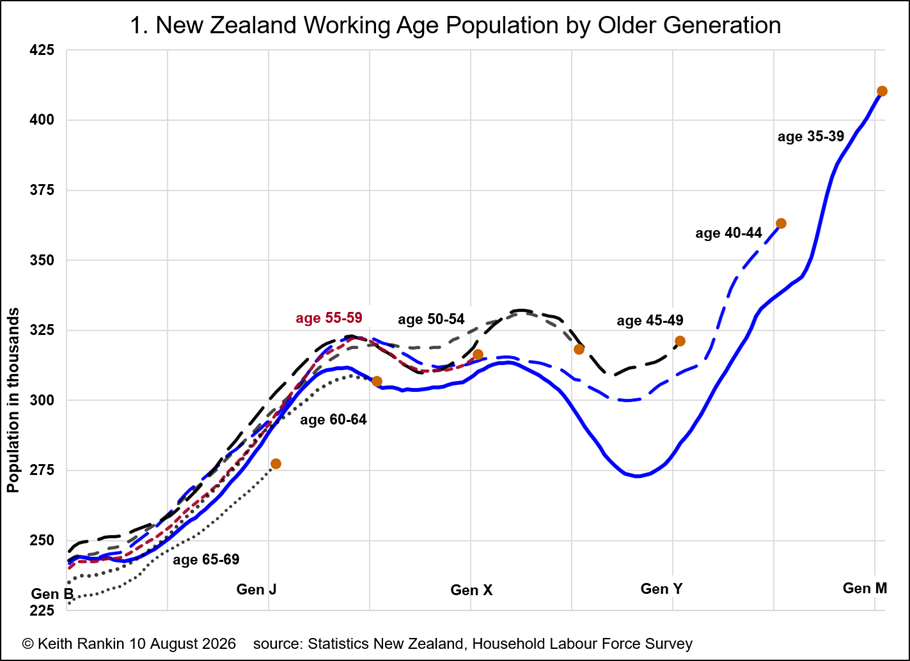
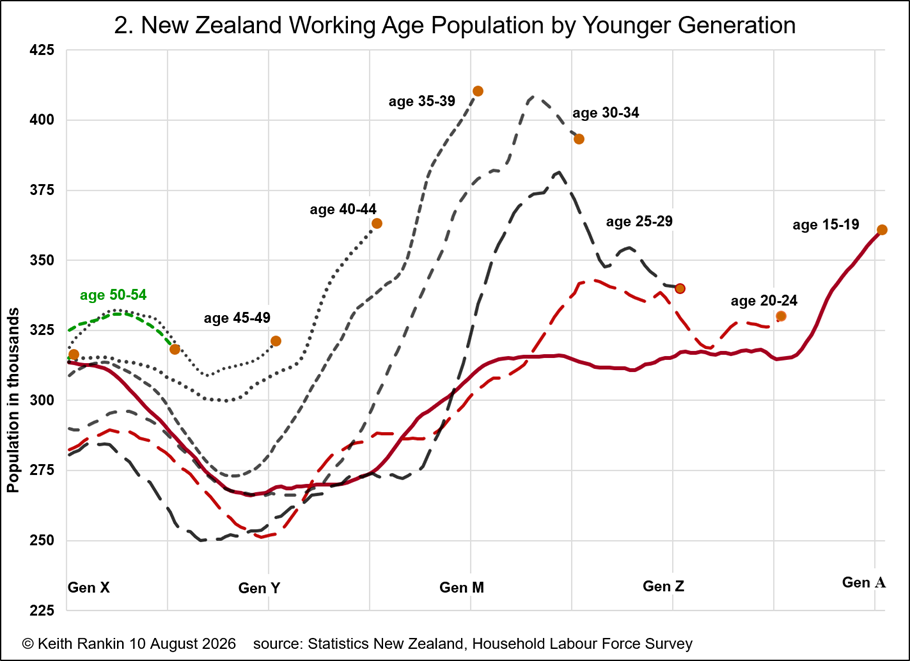
I have produced these charts of the New Zealand population organised by generation (aka birth cohort). I have labelled these generations B (boomer, born around 1950), J (Jones, born around 1960), X (born around 1970), Y (born around 1980), M (millennial, born around 1990), Z (born around 2000), and Α (alpha, born around 2010).
In a ‘global North’ country with minimal international migration, the population of a generation remains essentially the same until people are in their forties, and then we see a contraction – a ‘die off’ – as mortality makes discernible inroads into that population. Where international migration is significant, it is populations aged between 20 and 45 whose cohorts are expanding.
Chart 1 looks at older generations, from B to M; Chart 2 looks at younger generations from X to Α.
Chart 1
The first thing to note in Chart 1 is the ‘baseline’ of people aged 35-to-39. This is in solid blue, and reflects substantial amounts of immigration and emigration of people aged under 35. Nevertheless, the outlines of birth numbers are clear. New Zealand’s birth peaks were in the early 1960s (late Gen J) and early 1970s (late Gen X). Then there was a substantial ‘baby bust’ (Gen Y) followed by a ‘baby blip’ (Gen M). We note that the principal reason for the excess numbers of Gen M people aged 35-to-39 is immigration, not a domestic baby boom; and it may well be that many of these people do not have ‘permanent residence’ status, so may be subject to forced emigration in the next five years.
We also note that current (ie June 2026) populations for each age group and birth-cohort (from Gen J) are marked by a big orange dot. These dots tell us that the numbers of younger Gen Js, Gen Xs and Gen Ys are fairly similar to each other, thanks to some evening out resulting from net immigration. But their numbers are much higher than the numbers of ‘boomers’ (Gen B).
The next thing to note is that, for the most part, generations reach their maximum size when aged 45-to-49. Net immigration to New Zealand increases these cohorts when they are younger adults; then generational die-off becomes the principal demographic dynamic after age 50. In the case of Gen X, the immigration effect predominated until ages 50-to-54. And then we see what looks like a discernible Gen X die-off from age 50-54 to age 55-59.
The working-age die-off of Gen-B is quite small, from about 245,000 people at age 45-49 to about 230,000 people at age 65-69 (a die-off of 15,000). The comparable die-off for Gen J looks to be somewhat greater: 25,000 (from 305,000 to 280,000). We also note that, for the span of Gen X, there is a worrying level of mortality as they reach their late fifties and early sixties.
It would appear that we may attribute to Gen J and Gen X – rather than Gen B – much of the present increase of chronic illness noted by Hato Hone.
Chart 2
This chart looks at younger generations. The ‘baseline’ given here – in solid red this time – reflects mostly births, though many of the births for Gen Α in particular will be births to parents born outside of New Zealand. Immigrants generally have relatively high birth rates.
Looking at that baseline, of greatest significance is a dramatically higher number of teenagers in the mid-2020s compared to what we were used to over the previous two decades. This looming labour supply bulge will compound the labour market difficulties currently being faced by 20-to-24 year-olds.
Next we look at the big orange dots, and note that there is a huge present population bulge for Gen M; the ‘baby blip’ generation has been substantially augmented by immigration. Given the state of the New Zealand economy, it’s unlikely that Gen Z will see a boost of immigrants aged 30-to-40, which is what Gen M experienced. Indeed, Gen Z may well shrink in New Zealand over the next five years; net emigration. So the Gen M bulge will remain.
New Zealand had 300,000 Gen M people born around 1990 when they were aged 20-to-24, and now has 410,000 people born around 1990. Given that we know a lot of millennials have emigrated, it would seem that as many as 40% or 45% of this birth cohort in New Zealand were born overseas. Is New Zealand the country in the world with the greatest churn of peak-working-age population, with more immigrants coming as many emigrants go?
Conclusion
New Zealand’s working-age population is in flux. Good for the international airlines which fly to Aotearoa, but potentially very difficult for the making of social policy. Mind you, if the policymakers don’t really know about these dramatically fluctuating demographics, then they will be blissfully unaware of the difficulties which they face.
About the writer:
Keith Rankin (keith at rankin dot nz), trained as an economic historian, is a retired lecturer in Economics and Statistics. He lives in Auckland, New Zealand.