
Analysis by Keith Rankin.
Role: Economic historian.
Keith Rankin, 16 July 2026 – There is much loose political talk in New Zealand about the ‘retirement age’ and whether it should be raised; meaning the age of entitlement to New Zealand Superannuation which is a universal pension.
If we continue to use the term ‘retirement age’ as a fixed age set by legislation, we are perpetuating old-school assumptions around the male-breadwinner model; in particular the assumption that retirement is a life-stage (like a butterfly turning back into a dependent caterpillar). The assumption is that 64-year-old men should be fulltime paid workers and that retired men should be ‘out to pasture’. This assumption is perpetuated by Statistics New Zealand, which – in its Household Labour Force Survey – only formally publishes age-related data for age brackets from 15-19 through to 60-64 (though limited information can be found about 65-69 year olds). The presumption is that people working at post-retirement age are essentially stragglers.
Further, the idea of a retirement age at 65 is perpetuated by the whole KiwiSaver thing. KiwiSaver is at present a popular subscription-based savings scheme which levies employees today in return for a distant reward, and which taxes subscribers’ employers. (The ’employer contribution’ is levied as a tax equivalent; employers never get it back when they retire.)
Reality check
The charts below depict the growth of employment of New Zealanders aged over 65 and under 70.
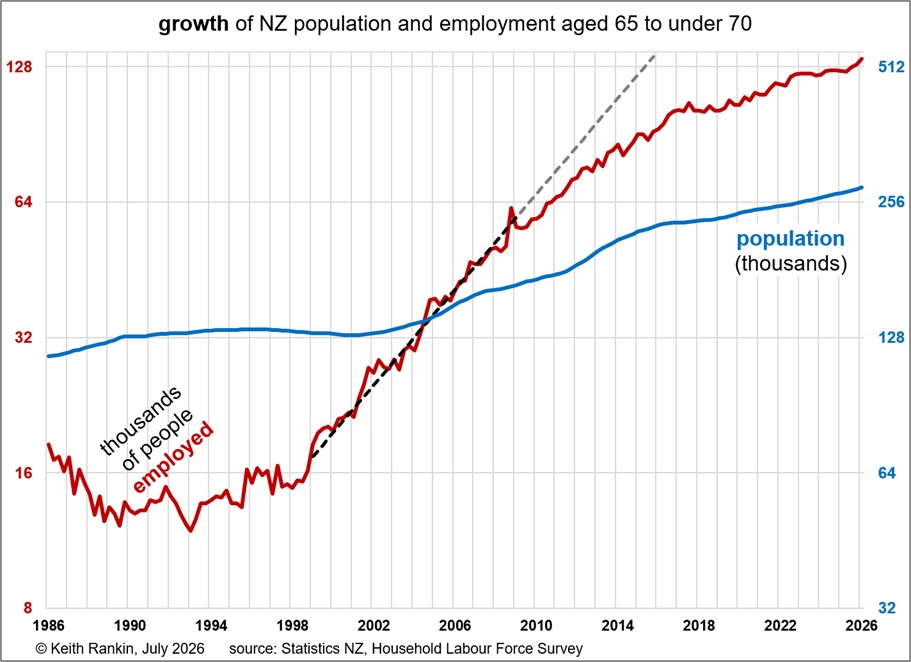
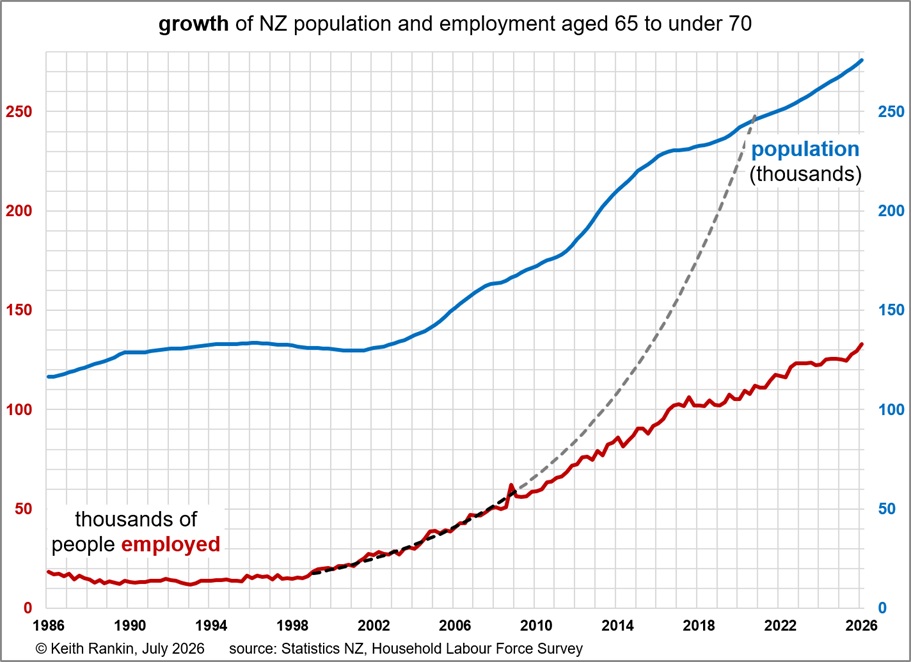
The first chart uses a ‘growth scale’ which means that a steady rate of growth can be depicted by a straight line. The second chart uses an ‘arithmetic scale’ which exaggerates recent data, though shows proportions better. The first chart shows both the growth of the population in that age group, and the growth of employed people. While the numbers for the two series are on separate scales (see the colour code), a given rate of growth looks the same for both the red and the blue series. So, for the period after 1999, the steepness of the red series indicates much faster employment growth than population growth.
In the first chart, first we see that the employment of 65-69 year-olds was consistently low, indeed falling below 12,000 in early 1993. As well as reflecting retirement as having been accepted as a life-stage, this reflects the very weak labour market in the late 1980s and in the early 1990s – the Ruthanasia years – and also a depletion of jobs during the downturn instigated by the 1997/98 Asian financial crisis.
Low employment growth for ‘seniors’ in the late 1990s also reflects the very slow-then-negative population growth in that age group. (In 1998, people aged 65 were born in 1932 or 1933, the peak years of the Great Depression, when birth numbers were very low. These people, from that low birth cohort, are now aged around 92.)
The low numbers of 65-69 year-old workers in the late 1990s also reflects the fact that the age of eligibility for New Zealand Superannuation was raised from 60 to 65 during that decade. And, there was an effective means-test on New Zealand Superannuation (then called Guaranteed Retirement Income) until Treasurer Winston Peters insisted that universality was restored. (Roger Douglas, Minister of Finance from 1984 to 1988, was a big fan of the word ‘guaranteed’, which some people still confuse with the word ‘universal’.) So most people who had been aged 60-64 in the first part of the 1990s were quite insistent on enjoying a full retirement from the age of 65; and that relatively privileged generation, for the most part, were not under much economic pressure to stay in work.
All changed in the 2000s’ decade. A combination of economic revival, population growth (shown in blue; the early-war baby blip preceded the post-war baby boom), and a simple rights-based pension which was not subject to a means test together triggered a decade of exponential growth of the employment of ‘young seniors’ (a useful name for 65-69 year-olds). The numbers of employed people in this age group quadrupled during that decade.
The exponential growth rate was thirteen percent per year; a very high rate (shown by the black dashed straight line). If it had continued at that rate, the grey-dashed-line shows that the numbers of employed young-seniors would have more than doubled again, to 130,000 during 2015. Obviously such exponential growth cannot continue forever.
The second chart shows (grey-dashed-line, a curve given the arithmetic scale) that, at that exponential rate of growth, all young-seniors would have been employed by 2020. (In this chart the two scales – red and blue – are the same; the blue numbers on the right match the red numbers on the left.)
The second chart shows that the number of not-employed young seniors has stayed about the same since the beginning of the 1990s; that’s the gap between the blue and the red series. The indication is that, under normal employment conditions, the number of fully retired young-seniors is not growing, despite the doubling of the number of 65-69 year-olds in the population over the last twenty years.
Analysis of the young-senior workforce dynamic
For my purpose here, it is probably most useful to define ‘young seniors’ as people aged 55 to under 75. Young seniors have always represented a dynamic component of the labour force; as have young people (aged 15 to under 25) and as have ‘married’ (today, ‘partnered’) women.
For young-seniors, the dynamic is modified by public pension arrangements; both the age of pension entitlement and the terms and conditions associated with public pensions.
(Part of the terms and conditions of a pension scheme can alter public perceptions around the acceptance of a pension; a pension that is understood as rights-based – especially a ‘dignity-enhancing’ pension funded by collective past paid and unpaid contributions to economic prosperity – is favoured by recipients over a pension that is perceived as a ‘dignity-eroding’ transfer or ‘hand-out’.)
In modern labour economics, there are two dynamic ‘supply-side’ elements that contribute to the numbers of people in the ‘labour force’. (Note that the important ‘demand-side’ determinant of employment applies when consumer and/or government spending is weak; weak demand for goods and services means weak demand for labour. New Zealand is very much in phase of labour-demand weakness; a phase which began some time in 2023.)
Supply-side elements are the choices by people – as individuals, or as members of households – about the extent to which they want to ‘rent out’ some of their time to employers (as wage or salary workers) or directly to customers (as self-employed people). The crude version of labour supply is binary: any amount of time rented out by an individual counts a person as employed, otherwise they are not-employed. (This is of course unsatisfactory, but for simplicity I will follow this simple presumption.)
Labour economics also adopts another crude division; dividing the not-employed into two categories: ‘unemployed’ (the smaller category) and ‘not in the labour force’ (almost always the larger category). The way that this is done is – or at least should be – controversial; the result is that there are two very important dynamics in play with respect to the ‘not-employed’. These two dynamic groups – added workers and discouraged workers – often cancel each other out, which allows both groups of would-be workers to be largely ignored at times of high unemployment.
Discouraged Workers
The more recent conventions – in play internationally since the global neoliberal revolution which took place mainly in the 1980s – treat discouraged workers as vacationers, going on to presume that these people drop out of the workforce whenever wages fall below their ‘reservation wages’. The effective conclusion is that a significant number of working-age people take advantage of periods of low wages to take a holiday; for the poorest of these people, it’s an urban (or, increasingly, suburban) camping holiday. One non-neoliberal economist said that the economic liberals – neoliberals and neoconservatives – think of the Great Depression as the Great Vacation.
These economic liberals claim that such discouraged workers are ‘voluntarily unemployed’, and therefore should be categorised as neither employed nor unemployed; that is, they should be stuffed into the same statistical ‘remainder’ category otherwise allotted to retired persons, housewives, and fulltime students. This categorisation has been accepted, for many decades now, by the International Labour Organisation (based in Geneva) and so has become institutionalised in all labour-market statistics.
Unemployed workers are recategorised as discouraged workers if for any reason they are judged to be not looking assiduously enough for a job, or if they are not immediately available to start work. The ‘not immediately available’ disqualifier excludes people who, when they lost their jobs, had to withdraw children from childcare. Many unemployed older people – not required to be actively seeking work in order to receive a pension – do not easily fit the strict ILO definition of unemployment.
Recessions – especially longer or deeper ones – are characterised by large amounts of ‘discouraged workers’. It means that in periods such as the early 1990s – the deep Ruthanasia recession – true unemployment was much higher than cited unemployment. We see in the first chart that the entire fall-off in the employment of 65-69 year-olds was due to that recession and the one in the 1980s immediately before. (It was a ‘double-dip’ recession.) Very few of those ‘not-employed’ were counted then as ‘unemployed’; rather they were counted as ‘retired’, as ‘not in the labour force’.
Added Workers
The important dynamic – which should be informing ‘retirement policy’ – is the added-worker effect (and its counterpart, subtracted workers).
In studies of the Great Depression – including my own MA thesis – the principal focus was on added female workers and added young workers. During the Great Depression in New Zealand, there was actually a rise in young female employees, despite mass unemployment generally. Further, huge numbers of female non-workers became unemployed because they responded to the circumstances of unemployed (and underemployed) husbands and fathers by going out and making themselves fully available for employment.
Such women and girls may be said to be ‘distress added workers’. When conditions returned to normal, and the husbands and fathers got their jobs back, they would become subtracted workers, withdrawing from the labour force. An important feature of the subtracted-worker effect used to be a rise in the birth rate after a recession. During the recession – with the Great Depression being the template – married women were more focused on securing an income, and single women delayed marriage plans.
In the ‘breadwinner model’, when the breadwinner can no longer earn enough to support the household, then the whole household (of adults) becomes part of the labour force. We continue to acknowledge this today, because when a married sole-breadwinner becomes unemployed, the marriage partner also becomes unemployed as a condition of their receiving a ‘job-seeker’ benefit.
Retirement-age added workers were also important during the Great Depression, but less so in countries like New Zealand which had income-tested pensions. The age-benefit was easy enough to get in the Great Depression, so substantially reduced hidden elderly unemployment.
Informing ‘Retirement-Age Policy’
By ‘Retirement-Age Policy’ I mean any policy which is intended to impact the incomes and workforce choices of people in the age group 55 to under 75 (ie 55-74 year-olds; aka, young seniors, broadly defined). (I do not include the National Party’s policy on KiwiSaver contributions, even though National’s policy substantially alludes to retirement-age politics.)
New Zealand is somewhat unusual in that the centre-piece of retirement income-support is a universal opt-in schemewhich pays any New Zealander aged over 65 (except for certain categories of immigrants) a minimum of $300.26 per week and a maximum of $555.15; plus a weekly ‘winter energy payment for part of the year of $20.46.
(The variation in payments arises both because New Zealand Superannuation is formally classed as taxable income, and because there are extra payments available to people who are ‘single’ and who are ‘living-alone’. A ‘partnered’ person without employment typically gets $427.04 per week. A partnered Superannuitant in ordinary fulltime employment gets $344.54 or $329.78 per week, depending on their marginal tax rate.)
What is the added-worker dynamic in New Zealand? The usual dynamic applies whereby in tight times (such as now, see the senior-employment uptick from 2025 to 2026), more people aged over 65 wish to stay in employment for household ‘cost-of-living’ reasons (which increasingly include rent and/or debt). If they cannot find a job (ie if they are unemployed when they turn 65, or need to re-enter the labour force after turning 65) they likely will be both added-workers and discouraged-workers, meaning they will be statistically invisible. The presence in the labour market of these invisible would-be workers is only revealed when the economy recovers; in the economy’s recovery phase, they often have advantages over young unemployed workers because of their experience.
The other offsetting dynamic is the presence of restrictions or disincentives. Means-tested pensions have restrictions, by definition; so non-universal age-income-support mechanisms inhibit the seniors’ added-worker effect. So, in New Zealand (without restrictions or disincentives), a significantly larger proportion of people over 65 are employed (and counted as unemployed) than in, say, Australia.
Further, regardless of tight economic times, in both New Zealand and Australia there are many people – especially aged 65-74 – whose first preference (regardless of economic conditions) is to be in the labour force. This is both because people born from the 1930s to the 1950s are living longer than their predecessors (mostly a result of rising living standards in the second half of the twentieth century), and because there is more awareness of ‘blended’ lifestyle options (where ‘blended’ means a mix of roles, which includes some paid work). Indeed blended lifestyles increasingly characterise the whole of young-seniorhood, from age 55.
The desire for blended lifestyles – mixes of paid work and other activities – generate an added worker effect for people aged 65-74, and a subtracted-worker effect for people aged 55-64. Retirement-provision systems with restrictions inhibit both. Thus the KiwiSaver age restriction inhibits people aged 55-64 from shifting to more-favourable work-life balance.
(So does the lack of a 55-plus benefit, which used to exist for a while in the 1990s. “In the 1990s, the ’55-plus benefit’ was an emergency unemployment benefit introduced in 1992 specifically for displaced older workers. It did not require recipients to actively seek work. In October 1998, the government replaced it with the ‘Community Wage’.”)
The then unpublicised removal of the ‘non-qualifying spouse’ provision for New Zealand Superannuation in 2020 also removes socio-economic flexibility for partners under 65 years-old.
And means-tested pensions inhibit the lifestyle – work-life balance – benefits of the added-worker effect for 65-74 year-olds. With restrictive retirement-income policies, more people aged 55-64 work extra hours under sufferance. And more people aged 65-74 work fewer hours than they would prefer, again under sufferance. It is the universal approach to retirement policy that yields the greatest socio-economic efficiency.
Making way for young workers
Under a system of socio-economic efficiency – as opposed to a system where choices about retirement are largely imposed – older workers actually start to make way for younger workers sooner; and older workers are increasingly enabled to contribute to society in ways other than paid work under sufferance.
In the absence of politically-driven age restrictions and means-tests, many more older workers continue to contribute to the economy in positive ways, based on their own understandings of how they can contribute, and what work-life balance works best for all the stakeholders in seniors’ lives. One form of work that older workers can do – on a paid, unpaid (voluntary), or underpaid (ie semi-voluntary) basis – is the mentoring of younger workers into positions of responsibility and leadership.
Good or bad thing?
Higher rates of employments of people aged 65-69 may be both a good thing and a bad thing. Where it reflects the work-life balance of seniors in reasonably good health, more paid work provides benefits for older and younger people, and reduces production constraints arising from aging populations.
But when older people are (for purely economic reasons) added workers clinging onto jobs which they would rather retire from, then they are simply blocking the employment pipeline – gumming up the works – and contributing to the difficulties being faced in making young people productive. An important aspect of preventing elderly-poverty in any society is to facilitate the productiveness of the generations of their adult children and grandchildren.
1938-1940 Universal Superannuation
New Zealand’s universal system of New Zealand Superannuation had its origins in the late 1930s, after the Great Depression. Labour won the 1935 election on the back of promises to universalise and extend social security. As is common, the most vociferous opponents of universal social security were the elites of the time; the irony is that the argument most deployed against universal systems is that they provide benefits for the wealthy, yet it is the wealthy who most oppose them. (The elites do have the nous to understand that universal systems do not benefit the wealthy in the manner of that critique; rather they empower the non-wealthy into making efficient socio-economic choices, including giving non-elites bargaining power.)
Eventually, and because the 1935-1938 Labour Government was elected with a broad constituency including rural and self-employed people (the ‘petit-bourgeois’!), that government was able to put a set of universalist proposals to the electorate in 1938; and as a result they won a sweeping victory. (They avoided the economic policy timidity trap which controls politics today.)
The centrepiece of the 1938 policy was Universal Superannuation, the policy – to become operational in 1940 – was to pay a small universal benefit (the word ‘benefit’ had positive connotations then) to every ‘senior’ person, including ‘young seniors’, and including women who had contributed so much in ways other than through paid work.
The policy was popular and affordable. While that government had to constantly wrestle with the ‘where will the money come from?’ critique from the elites, it delivered, and well-under budget. (Sadly the superannuation policy’s main salesman, Michael Joseph Saveage, died before his masterwork became operational.)
It was always understood that the amount paid would be able to increase substantially over time; as indeed it did. And the New Zealand economy grew through the following decades, despite all manner of demographic and terms-of-trade constraints. The fact that the initial offering was small conferred a political advantage; the policy was both visionary and affordable, so was difficult for political opponents to undermine.
The trick was to sell a small universal benefit as a core part of a much larger vision. Many older New Zealanders continue to lead good lives today on account of the practical success of that vision. Ironically, it was the much derided Sir Robert Muldoon who was the last great proponent of Mickey Savage’s socio-economic vision. It was after the political downfall of ‘Muldoonism’ – a political style mischaracterised as a failed economic strategy – that the economic liberals (the classical liberals of early nineteenth-century policy-making) replaced socio-economic efficiency with a targeted and punitive approach to social security.
Conclusion
The labour supply of older New Zealanders is a critical but under-understood component of what makes liberal capitalist societies continue to tick. Universal pension provision has huge benefits to society, including enabling older people to stay in the paid workforce, working and living under their own terms, and mentoring the young.
Alternative policies, whether imposing means-tests, or delaying access to retirement income, create substantial socio-economic inefficiencies. Making people work under sufferance until they are 67 (or older), and then retire, does not facilitate a liberal work-life balance; does not ensure the best mix of labour market and non-labour-market activity to support the changing population age structure.
Appendix
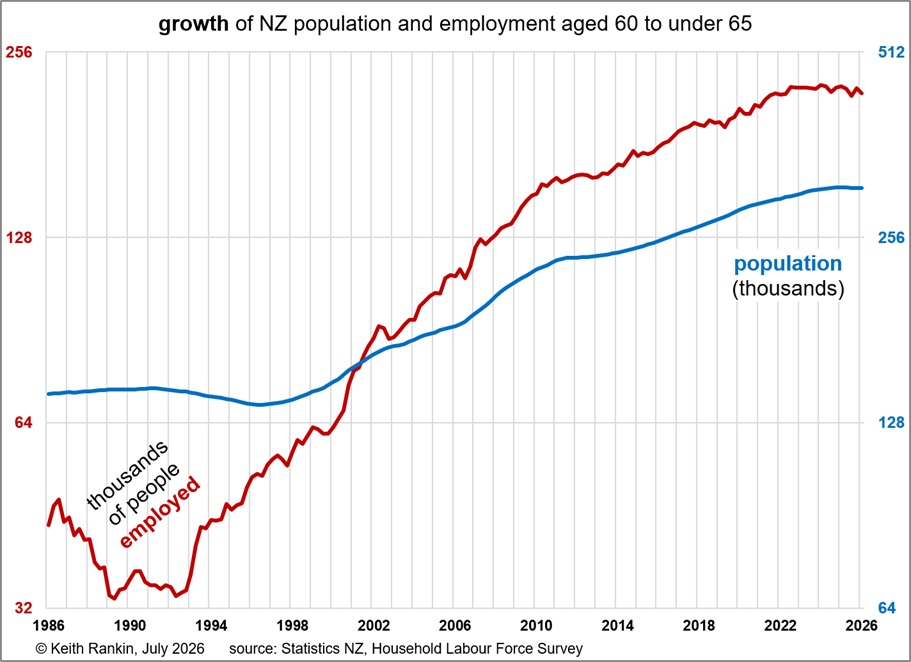
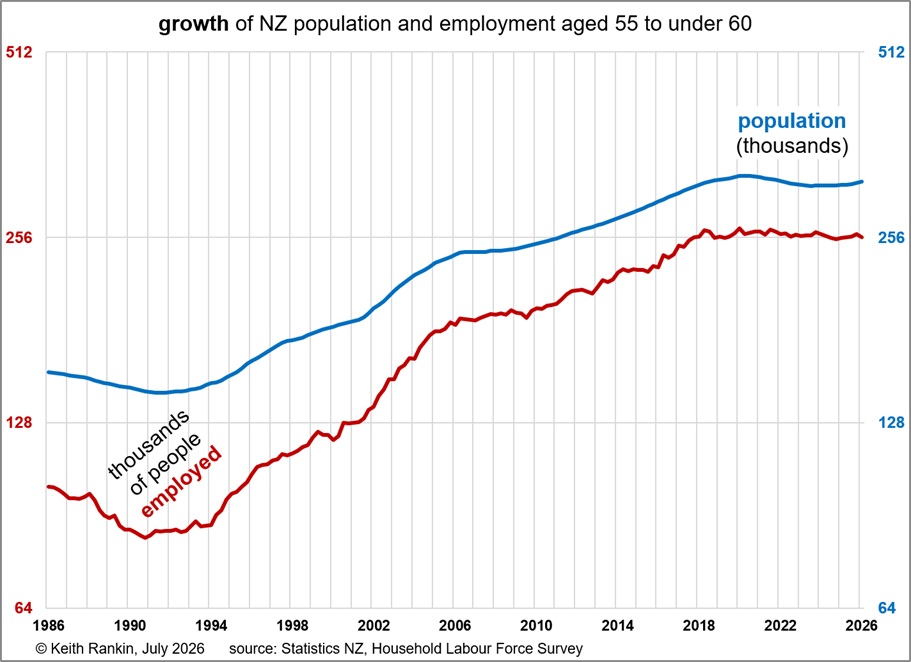
I finish with, for interest, the growth charts for 60-64 year-olds, and 55-59 year-olds. The 60-64 chart, in particular, should be understood in the context of the increase that decade in the age of Superannuation from 60 to 65.
About the writer:
Keith Rankin (keith at rankin dot nz), trained as an economic historian, is a retired lecturer in Economics and Statistics. He lives in Auckland, New Zealand.