
Analysis by Keith Rankin.
Role: Economic historian.
Keith Rankin, 9 July 2026 – The authorities’ policy of economic cruelty continues, with yesterday’s rise in the Official Cash Rate in the middle of an ongoing (and possibly deepening) economic crisis. Refer OCR Increased To 2.50% To Return Inflation To 2%, Scoop, 8 July 2026.
The argument originally presented, a few months ago, for a rate hike in July was that the Israel-US-Iran war would lead to significant cost increases which would then unleash ‘inflationary expectations’ which would need to be quelled by higher interest rates (where higher interest rates would serve as a Pavlovian signal for employers and workers to expect lower inflation).
The story we got yesterday was that, while such war-based expectations had already been quelled, nevertheless interest rates would still need to go up to some ‘neutral’ level; the storytellers (including miscellaneous bank economists) asserted that the OCR of 2.25% was ‘stimulatory’. The argument was that the New Zealand economy is now in the initial phases of an economic growth boom, is presently overstimulated, and that the inflationary expectations arising from this projected boom would need to be pre-emptively quelled! As if taking steps to aggravate a cost-of-living crisis reduces, as a matter of course, inflationary expectations.
Most people, quite rightly, think that the imposition of higher costs means higher (than otherwise) price increases. Indeed, you would have to be living in a rabbit-hole or echo-chamber or faith-based community (or all three) to believe that additional higher costs lead to lower price increases.
Nobody can tell us what the ‘neutral rate of (OCR) interest’ is; though there is a clearly claimed claim that the neutral rate is above 2.5%. (We should note that there may not even be a neutral rate. Or there may be a floating neutral rate. It’s ungrounded woohoo economics.)
The Neutral Rate of Interest (OCR)
We only have to look at the Reserve Bank’s own chart, to see that the best estimate of a neutral rate is the 1.75% which prevailed from late 2016 to mid-2019. In those years – years of stable on-target economic growth – the inflation rate was stable between 1% and 2%.
If anything the 1.75% OCR was above the neutral rate, given that the annual inflation rate stayed stubbornly below the 2% target. Further, in May 2019 the OCR was decreased from 1.75%, as evidence accrued that the 1.75% level was mildly contractionary. The 2019 cycle of OCR reductions brought that rate down to 1% by September. Inflation indeed increased to 2.5% in February 2020, just before the Covid pandemic. The clear evidence here is that neutral, if it exists at all, is about 1.25%.
We also note from the Reserve Bank’s own chart that there were two mistaken attempts in the early 2010s to raise the OCR. Both attempts were explained, effectively, as ‘stimulus reducing’ rate hikes – likened to easing the accelerator rather than deploying the brakes; thus, in both those cases, the belief was that there was a neutral OCR interest rate around 3.5%. And in both cases reality required the Bank to reverse its stance. The evidence became clear (to those willing to see it) that the neutral interest rate was no higher (and probably lower) than the then prevailing 2.5%. Hence OCR rates were brought down to 1.75% in 2016. And that 1.75% proved to be the ‘sweet spot’, at least until 2019 when it appeared to be too high.
(We note that in those years from 2014 to 2019, interest rates in Europe and Japan were set at zero percent or lower, and that those settings proved stable until the Covid19 pandemic which started in 2020. Thus, for the best part of a decade, the neutral interest rate in Europe was zero. And the neutral rates in North America and the United Kingdom were below one percent.)
What actually happens to inflation with high and rising interest rates?
We can look at New Zealand in the late 2000s, and at our ‘Anglo-Saxon cousins’ in the years after the elimination of Covid’s delta strain, meaning the years when the ‘pandemic crisis’ – as distinct from the pandemic itself – were over.
In New Zealand in late 2003, the OCR was set at 5%. Since then there was a long tightening cycle taking the OCR to 8.25% in mid-2007, and keeping the OCR there until July 2008. Interestingly this – from 2004 to 2007 – was a period of significant increases in the exchange rate of the New Zealand dollar (NZD) meaning that, on that basis alone, inflation in New Zealand should have been very low. In fact, from 2004Q3 to 2008Q3, inflation averaged 3.4%; going up to 5.1% in the year to September 2008. (In late 2008 and early 2009, the OCR interest rate was slashed within a year from 8.25% to 2.5%; those high interest rates had been an important contributing cause of the 2008 Global Financial Crisis.)
Clearly, the rises in the OCR from 2003 to 2007 were aggravating inflation, not dampening it!
In the United States, interest rates stayed at 0.25% until March 2022. They then increased to 5.5% in 2023; and started falling late in 2024, tapering off at 3.75% at the end of 2025. Annual inflation peaked four months after the rise in interest rates, and then fell over the next year. Then from mid-2023 annual inflation in the United States stayed around 3%; until, that is, inflation went up this year to 4.2%. The United States was unusual compared to Europe in keeping its interest rates high; probably as a result of this, inflation stayed high in the USA compared to Europe. (Of late, France’s interest rates have been 2.15% and inflation around 2%; and this is normal for Europe.) The evidence here points to a direct causal relationship in the United States from higher interest rates to higher inflation rates.
In Canada, interest rates followed a similar cycle to that of the United States. But the peak was lower, and the climb-down from the peak went further. Most likely as a result, the inflation rate came down more in Canada than in the United States because the interest rates also came down by more.
In the United Kingdom the raising and lowering of interest rates followed a similar cycle. The OCR-equivalent interest rate went up to 5.25% and the rate has subsequently only come down to 3.75%. Inflation in the last two years, while not as high as in the United States, has been significantly higher than in New Zealand and Canada.
Australia only raised interest rates to 4.35%, and definitely had less accumulated inflation than New Zealand in the years from 2021 to 2023. But Australia only lowered to 3.6%, and this year has pushed its interest rates back up to 4.35%, the same as the post-Covid high. With very high and now rising interest rates in 2025 and 2026, Australia has had significantly higher inflation rates than New Zealand in the last twelve months; in Australia annual inflation rose to over 4% at the beginning of this year! While the UK has had high and falling interest rates in the last year, Australia has had high and rising interest rates. In the United Kingdom, measured inflation has come down; in Australia it has gone up.
If this was a court case being put to a jury, the evidence is ‘beyond reasonable doubt’ that higher interest rates aggravate rather than ameliorate inflation. The Reserve Bank, like a crooked prosecutor, gets away with its counter-evidential claims simply because the evidence is not put to a jury of common sense lay opinion. The evidence presented here, while conclusive beyond reasonable doubt, is not at all technical; certainly much less technical than much evidence routinely put before juries in New Zealand.
The New Zealand Reserve Bank thinks of itself as a science-based organisation. But it rarely addresses the quite available historical evidence which refutes the narrative that higher interest rates are required to lower inflation.
The state of the New Zealand economy
For more evidence, to understand the state of the New Zealand economy, we only have to look at my recent article NZ Economic Growth Over The Medium Term, where I published a chart showing that for the last 12 months, New Zealand’s GDP has been lower than GDP two years earlier. In common parlance, that level of low economic growth is called a recession. And all manner of social statistics support the evidence that the New Zealand economy is in a recessionary hole; and that the last thing it needs is a counter-stimulatory monetary policy.
Below I present a new version of that chart, this time showing per-capita GDP. This shows the growth or otherwise of output per person in the New Zealand economy. (This chart is really a measure of productivity, in that it only accounts for the working-age population; not the total population.)
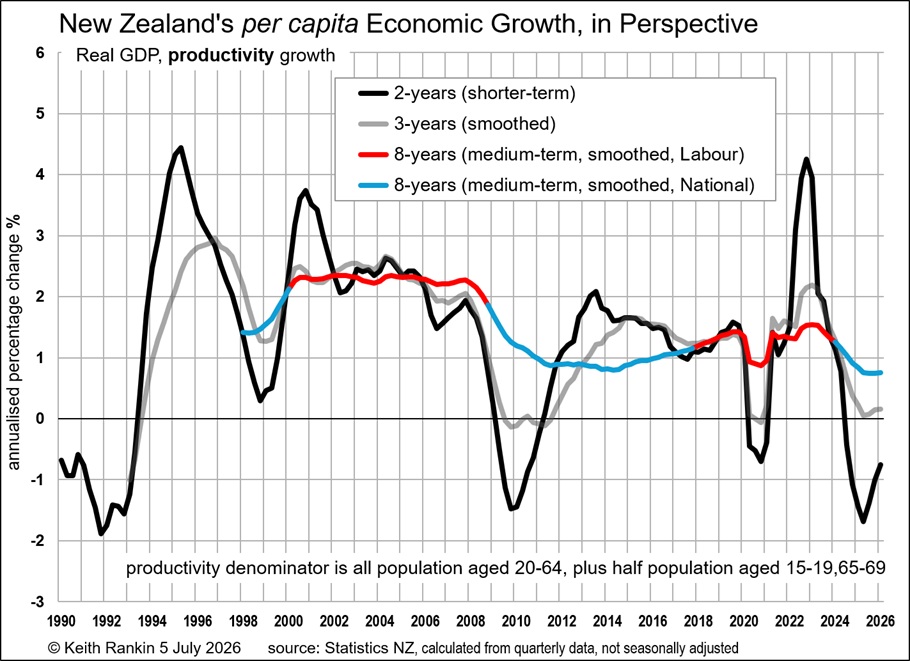
This chart shows that the decline of the New Zealand economy began in 2023, an election-year which in the old-days would have featured a pre-election fiscal stimulus. But the Hipkins-led Labour government, favouring austerity-mode over election-mode, preferred to concede government than to follow a stimulatory policy. Labour walked haplessly into its biggest ever defeat, having three-years earlier secured its equal-biggest-ever victory.
Matters then got worse, with the present National-led government doubling down on fiscal austerity in the hope that the Reserve Bank would continue to provide reduced monetary austerity. Now the Reserve Bank has commenced a policy of escalating monetary austerity; a policy likely to dampen down any recovery which might have been underway in 2026.
Will the present recession be more like that of 2009 or that of the early 1990s? While the jury is out, the domestic situation New Zealand faces is more like that of 1990 than that of 2009. We note that, after 1990, New Zealand moved into a severe double-dip recession.
In the meantime, a growth of annualised productivity from about minus two percent to minus one percent is hardly an indication of boom times ahead.
Employing today’s teenagers tomorrow
I note that the Reserve Bank notes that there is “spare capacity” in the economy, and that the presence of spare capacity is a counter-inflationary influence. I will finish my argument against the present counter-stimulatory stance of the Reserve Bank, by noting a particular feature of coming ‘spare capacity’. That is our teenage population cohort.
My Growth of New Zealand’s Working Age Female Population (published 8 July 2026, and with an appendix for the male population) showed that the resident New Zealand population aged 15 to under 20 (taking this as New Zealand’s present teenage population) is substantially higher than in previous years.
The New Zealand population aged 15-19 in March 2026 was 13.3% higher than it was in March 2021. (In March 2026 there were 10.6% more employed teenagers, 58.1% more unemployed teenagers, and about 7.6% more teenagers aged 15-19 in education or training or neither.) Here we have a huge potential to contribute to the New Zealand economy in the next few years. But we will need to have a strong polytechnic system – focussed on educational outcomes rather than on business profitability – if we are to make sensible use of this ‘windfall’ human resource.
The signs are that our authorities will cast this birth-cohort into the labour-market underworld (or to Australia), as they did the previous two birth-cohorts (now aged 20 to under 30).
I note that, while employment of people aged 15 to under 20 increased 10.6% in the five years to March 2026, employment of people aged 20 to under 25 increased by minus 4.2% and employment of people aged 25 to under 30 increased by minus 8.4%. One important reason for this is the huge bleed of people in their twenties to Australia.
It is our most urgent priority, over the next five years, to render our present largesse of teenagers employable and employed. This means skills, and employment opportunities. The latest policy of the Reserve Bank – a kick in the guts to their putative employers – is a big ‘damn you’ to our present large cohort of teenagers.
Why do we tolerate a monetary policy which has a repeated tendency to ‘snatch defeat from the jaws of victory’ for countries’ economies? It’s because the priests (or hawks) of money spin an incomprehensible narrative that leaves most of the rest of us disengaged. The narrative renders good people helpless. Whenever the people complain about the high cost of living, the delegated academic spin doctors translate that into a wish for a brand of ‘anti-inflation policy’ which aggravates the high cost of living; and aggravates the human redundancy which is tearing apart our communities.
About the writer:
Keith Rankin (keith at rankin dot nz), trained as an economic historian, is a retired lecturer in Economics and Statistics. He lives in Auckland, New Zealand.