Analysis by Keith Rankin.
Role: Economic historian.
Keith Rankin, 2 July 2026 – Two weeks ago I published a chart showing New Zealand’s latest economic growth, showing the whole of the last two years compared to the whole of the previous two years. This gives a better picture than the usual charts which look at simple annual growth. If an economy is barely larger in the 24 months to March 2026 compared to the previous 24 months, then it’s too early to pronounce a return to ‘economic growth as usual’, let alone the success of a ‘growth strategy’. As it turns out, while 2025 GDP (gross domestic product) may have been bigger than 2024 GDP, it was hardly bigger at all than 2023 GDP.
My new chart uses the same data, but focusses more (and differently) on the latest 12-month period and placing that in a medium-term context.
Short-Medium and Long-Medium
These days ‘short-term’ change usually means very recent change (ie within the last 12-months), or – at most – comparing the most recent 12-months with the previous 12-months.
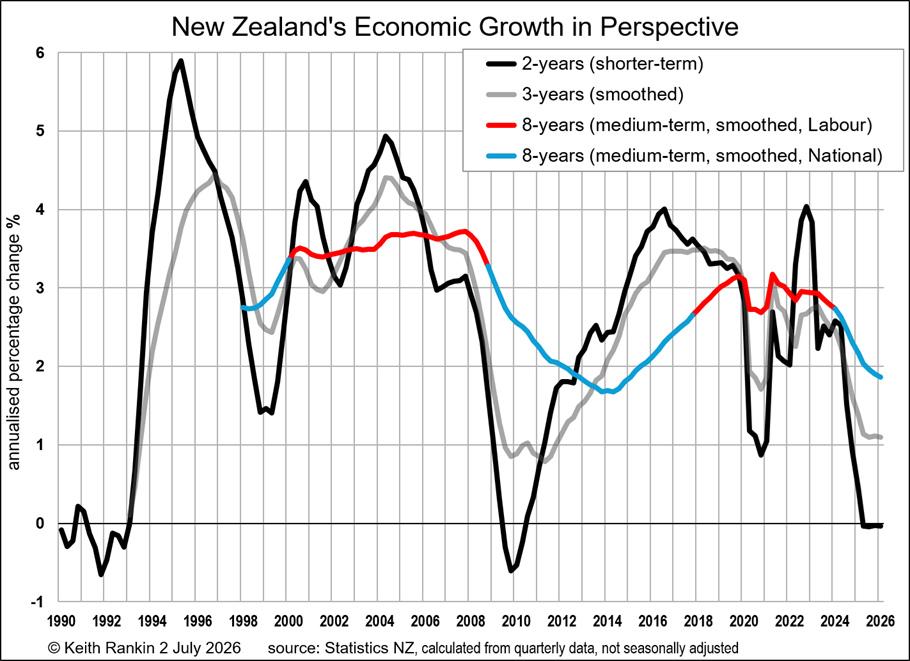
So I call the black plotted-line ‘short-medium’; looking back from 2025 or 2026 to 2023. The most recently-plotted point represents GDP for the year-to-March 2026 compared to GDP for the year-to-March 2024. (Points have been plotted every three months, so the previous point is the year-to-December 2025 compared to the year-to-December 2023.)
The black plotted-line shows that, from the year-to-June 2025, New Zealand’s total GDP (not GDP per person) has been lower than the whole year two years earlier. (Only slightly lower, and subject to revision; but lower nevertheless. GDP under National’s political watch has been lower than it was under Labour’s watch; despite National’s claim to giving priority to economic growth as a KPI [key performance indicator].)
We note that the three previous major downturns in the black plotted-line are clearly identifiable as the Asian Financial Crisis of the late-1990s, the Global Financial Crisis of the late 2000s, and the Covid19 Crisis of the very early 2020s. (None of these were attributable to wars.) On the other hand, the current recession and the early 1990s’ recession have been clearly connected to New Zealand’s macroeconomic-policy environment.
The early 1990s’ recession followed on from a recessionary period which began in 1986. This pattern of chronic recession is rare; it is more normal – in New Zealand and especially in other countries – for a recession to be immediately followed by a period of above average growth. (This is because post-recession growth is ‘low-hanging-fruit’, driven by reducing labour and capital surpluses, rather than being dependent on productivity growth.)
So, the very-early 1990s should have been a period of high growth. Eventually that very rapid post-recession growth did take place from 1993 to 1996, in the wake of a prolonged ‘double-dip’ recession.
The experience of the early 1990s gives context to the early 2010s; under a National-led government, as is the present non-growth experience. In the early 2010s, the recovery in New Zealand from the Global Financial Crisis was surprisingly slow; was significantly slower than it should have been.
These findings – relating to the early 1990s, the early 2010s, and now the mid-2020s – suggest that there is something fundamentally anti-growth in National governments’ policy-frameworks during the post-1984 neoliberal era. Growth-prioritisation rhetoric is not enough to actually achieve economic growth.
Labour-led governments – on the other hand, and without prioritising economic growth – have consistently achieved normal levels of growth (around three percent); indeed despite the Covid19 crisis and the Ukraine-Russia war which began early in 2022. The look of this chart is that, in practice if not in rhetoric, that National is anti-growth and Labour is not anti-growth. (My suspicion is that Labour, by running a larger governmental apparatus, inadvertently facilitated the circulation of money. While productivity did not grow remarkably under Labour; at least aggregate demand held up, enabling normal growth to take place.)
Smoothed Plots
The shortcoming of the black-line plot – and just about any other published growth plot, except in academic economic history – is that the earlier period being compared to the more recent period is itself only 12-months, and may in some cases lead to misleading results. Indeed we see this for the Covid19 period; with growth for 2022, in which 2022 is being compared to 2020, showing as artificially high.
The best way to address this is to compare a more recent period of one-year with earlier data that covers much more than one year.
So, consider the grey-plotted line. For this plotted line, annual data are compared to averaged five-yearly data. We see that the growth peaks and troughs are significantly less; that’s what smoothing does, to reveal the medium-term more and the short-term less.
The grey line confirms the same stories outlined above. But it shows the early-2010s’ malaise rather better than the black plot; the black plot overstating the recovery in 2011 and 2012. And it shows that the growth experience of the mid-2000s (under Labour) was more substantial than that of the mid-1990s (under National).
Now consider the blue-and-red plotted line; this represents the longer medium term. This compares the most recent year of data with five-years of data averaging eight years prior. (Eight years represents three inventory cycles of the New Zealand economy; inventory cycles are short-term growth spurts and pauses, which average at about 32 months.)
With the blue-and-red line, the shorter term growth fluctuations are ‘ironed-out’, and we see very clearly that economic growth operated at normal levels (three percent annually) while Labour-led governments were in power. And persistent below-normal growth ‘performances’ under National-led governments. (2016 medium term growth was, for example, surprisingly low, given the fact that the Global Financial Crisis was at the centre of the period being compared to 2016.)
Finally, we note just how little the Covid19 pandemic affected New Zealand’s economic growth. The present downturn, under National’s watch, looks like its heading for eight-year lows comparable to 2013 and 2014, or less.
Do we really care about the long term?
Many policy positions these days are claims that New Zealand must make policy for the long term rather than for short-term “sugar hits”. This item – Spend Today, Save Tomorrow: Budget 2026 Promises Restraint, Eventually – was almost certainly prepared by Ruth Richardson, who was Minister of Finance in the early 1990s (the Ruthanasiaperiod; see the chart above), and who is the current ‘brains’ behind the New Zealand Taxpayers’ Union.
Indeed, the National Party has a (KiwiSaver) savings’ policy whereby the government will put money in babies’ bank accounts at birth; money which they will only be able to access in or after 2093, and even that is contingent on the government not raising the ‘retirement age’. Long-termism gone mad!?
But our governments these days almost never look back; credible long-termism means looking back, critically appraising historical narratives and omissions. Last week I posted two charts which look back to 1957, and they tell a disturbing story about the real reasons for the prosperity of a significant minority of New Zealanders today. The Government has no idea about these facts; and I do not expect that anyone close to the government will have reflected upon my charts.
(Indeed the government has never informed New Zealand citizens the realised quantity and quality of the promised – eg $10 billion suggested in 2012, John Key reveals plan for asset sales, Stuff 6 Sep 2012 – gains to education, healthcare, and infrastructure spending arising from the ringfenced half-sales of our big electricity gentailers in 2013 and 2014. Stories about the gentailers include: Profit taking as thousands sell power shares RNZ 30 Nov 2015, and Four big gentailers face new competition rules in bid to level playing field RNZ 26 May 2026.)
Whereas the present government may be more interested in the 2090s than the 1990s, there is a movement on the political right to ‘reclaim’ history. See this item about David Seymour’s new friend (refer ACT’s David Seymour on latest weather events, climate change, RNZ 27 Jan 2026) Javier Milei: Javier Milei’s far-right rewrite of the past, The Listening Post, Al Jazeera, 30 June 2026.
The takeaway from the Listening Post report is: ‘whoever holds power in the present has the opportunity to distort the narrative of the past, and whoever controls the past (to a significant extent) determines the future’. (The exact quotation is: ‘George Orwell wrote in 1984 “Who controls the present controls the past, and who controls the past controls the future”‘.) We note that such distortions are most potently done by omission rather than by commission. Thus, it is up to people like me to post reminders about forgotten facets of the medium- and long-term past.
If we are going to play the long-term game – as John Key did, cynically, in 2012; and as politicians today do, when they repeat finance-industry talking points about retirement savings – then our powerbrokers should be urgently pressed into some reflective intercourse with the past, at least over a comparable timeframe. Thus, if we are to enact policies with the 2090s in mind, we should be looking back – critically – to at least as far as the 1950s. (It’s hard to do in New Zealand, though, because the 1950s to early 1980s are the least digitised part of New Zealand’s historical record; time-pressed academics often eschew such periods to study.)
About the writer:
Keith Rankin (keith at rankin dot nz), trained as an economic historian, is a retired lecturer in Economics and Statistics. He lives in Auckland, New Zealand.