Analysis by Keith Rankin.
EDITOR’S NOTE: Please refer to an updated version of this article by clicking here.
I have been investigating the epidemiology of the disease that arguably created the science of epidemiology; a blend of statistics, medical science, and demography.
The cholera outbreak in London in 1854 is particularly well-known, because of the reverence now given to the statistical analysis (by Dr John Snow) of the episode in London’s Soho which he demonstrated was centred around a drinking water pump in Broad Street (now Broadwick St.).
Recently I read the 2006 book by Steven Johnson – The Ghost Map – which gives a discussion of multiple themes: the spread of disease, the shortcomings of scientists, the huge potential of maps as a means of communication, and the sustainability benefits of uber-urban living.
I have also had the benefit of reading Frank Snowden’s 2019 book Epidemics and Society: From the Black Death to the Present, which has helped me on one particular point that Johnson’s account missed.
Here I will just look at the key facts of cholera in England from 1840 to 1867, with my sole data-source being ‘registered deaths’ per quarter, by district. England commenced birth, death, and marriage registration in 1837, so I am unable to show the first English outbreak in 1831.
Cholera, by the way, is a disease the lower digestive tract caused by the presence of the bacterium vibrio cholerae. It is characterised by extreme diarrhoea, with death coming – as it often but by no means always did – through extreme dehydration. It is transmitted via the oral-faecal route. It is not, as was widely believed throughout the nineteenth century, an airborne condition. Outbreaks occurred in the late summer.
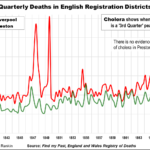
The first chart acknowledges that Liverpool, not London, was England’s ‘cholera central’. Liverpool was England’s most important seaport in those ‘Victorian’ times. I contrast it with Preston, an industrial revolution cotton-milling city (and minor port) 40 kilometres northeast of Liverpool. The railway arrived in Preston as soon as 1838.
Rather than showing a strong correlation, Liverpool shows clearly all four major cholera outbreaks in England in those decades (1847, 1849, 1854, 1866) whereas Preston shows none. While Preston probably had more air-pollution than Liverpool, it was Liverpool which was much characterised by water-pollution. (Nonetheless, my great-great-great grandfather-in-law, and his wife, died of cholera in September 1849, despite living in Clitheroe, upstream from Preston. He was a bookkeeper-manager of a small and successful factory, so he may have been in Liverpool just prior to his death, or Manchester which correlates with Liverpool while having significantly less cholera overall.)
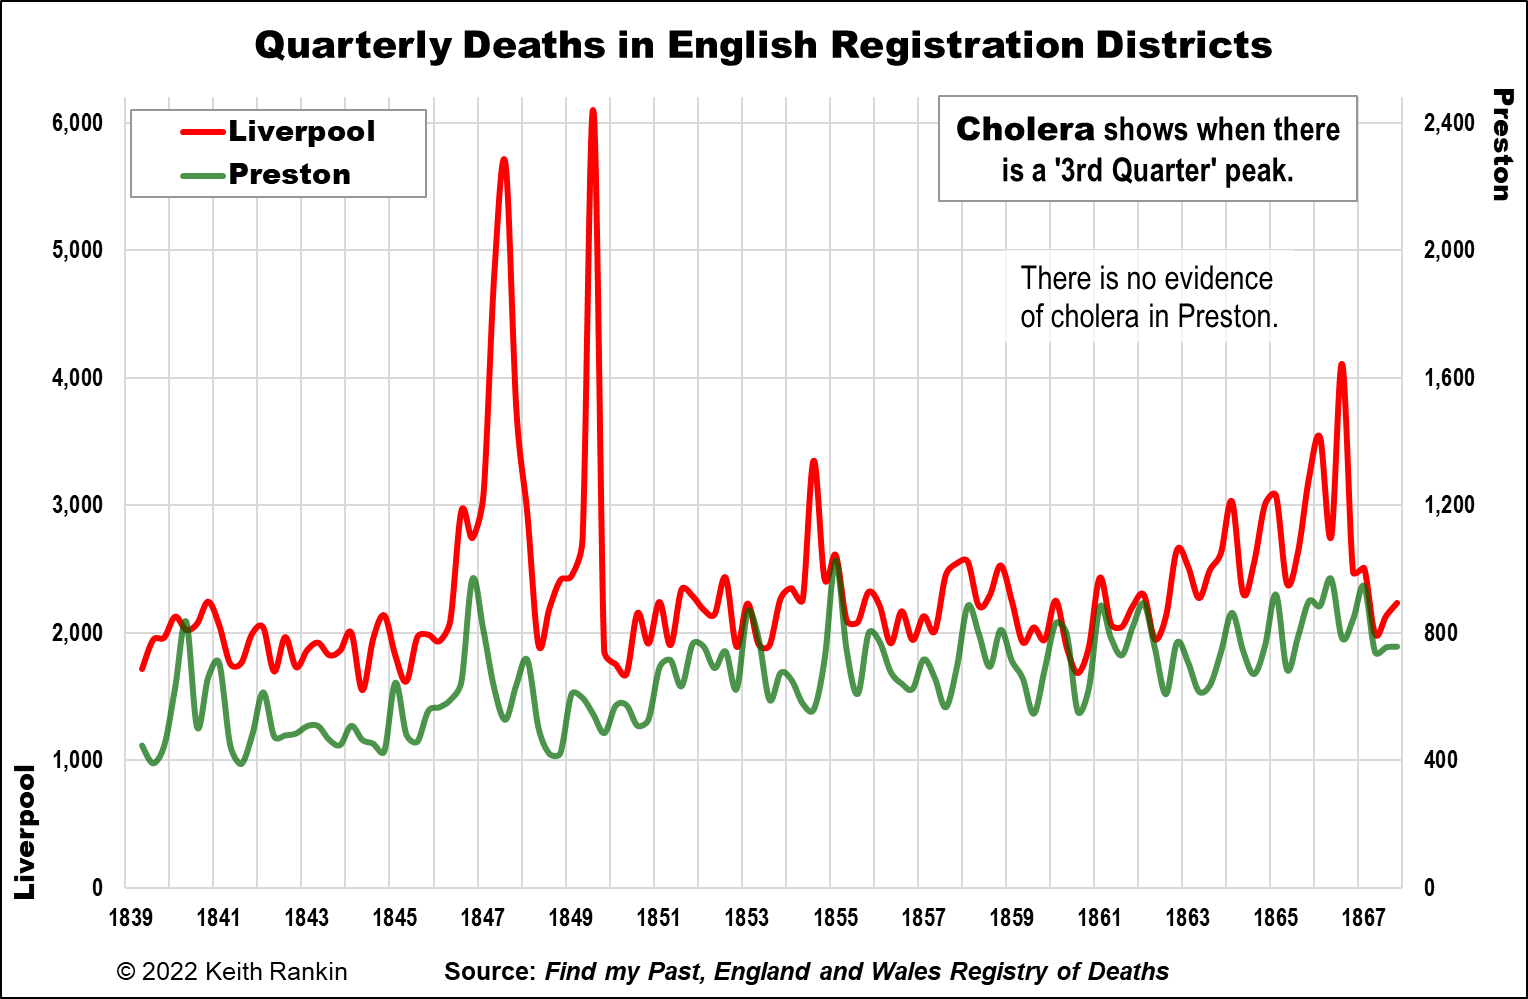
The second chart shows Liverpool and London together. While London shows minimal cholera in 1847, it shows that the other outbreaks were perfectly synchronised with Liverpool. Already it is clear that cholera was most likely an imported – and reimported – disease. It substantially affected England’s points of entry the most. (As of course, Covid19, which was synchronised in many countries through their airports.)
In the Liverpool/London chart, I attempt a ‘counterfactual analysis’. This is made simpler by the fact that cholera is clearly a seasonal disease, at least in places with highly seasonal climates. The dashed lines represent the likely numbers of deaths if cholera had not been present.
Much of the writing about cholera in Europe has little to say about this important seasonal feature of the disease. Outbreaks occurred in late summer (a little earlier in Liverpool in 1847), tending to peak (in the northern hemisphere) in early September. There are two reasons for cholera’s seasonality. Firstly, the bacterium (originally from Bengal, India) cannot easily survive in cold water. Second, and it’s only from Frank Snowden that I understood this, vibrio cholerae evades the defences of person’s stomach if they have eaten overripe fruit. Thus, the increased urban consumption of fruit made possible by the early railways almost certainly contributed to cholera epidemics. And poorer people living in places with contaminated water supplies were more likely to acquire their fruit in the market at lower prices, when it was past its best.
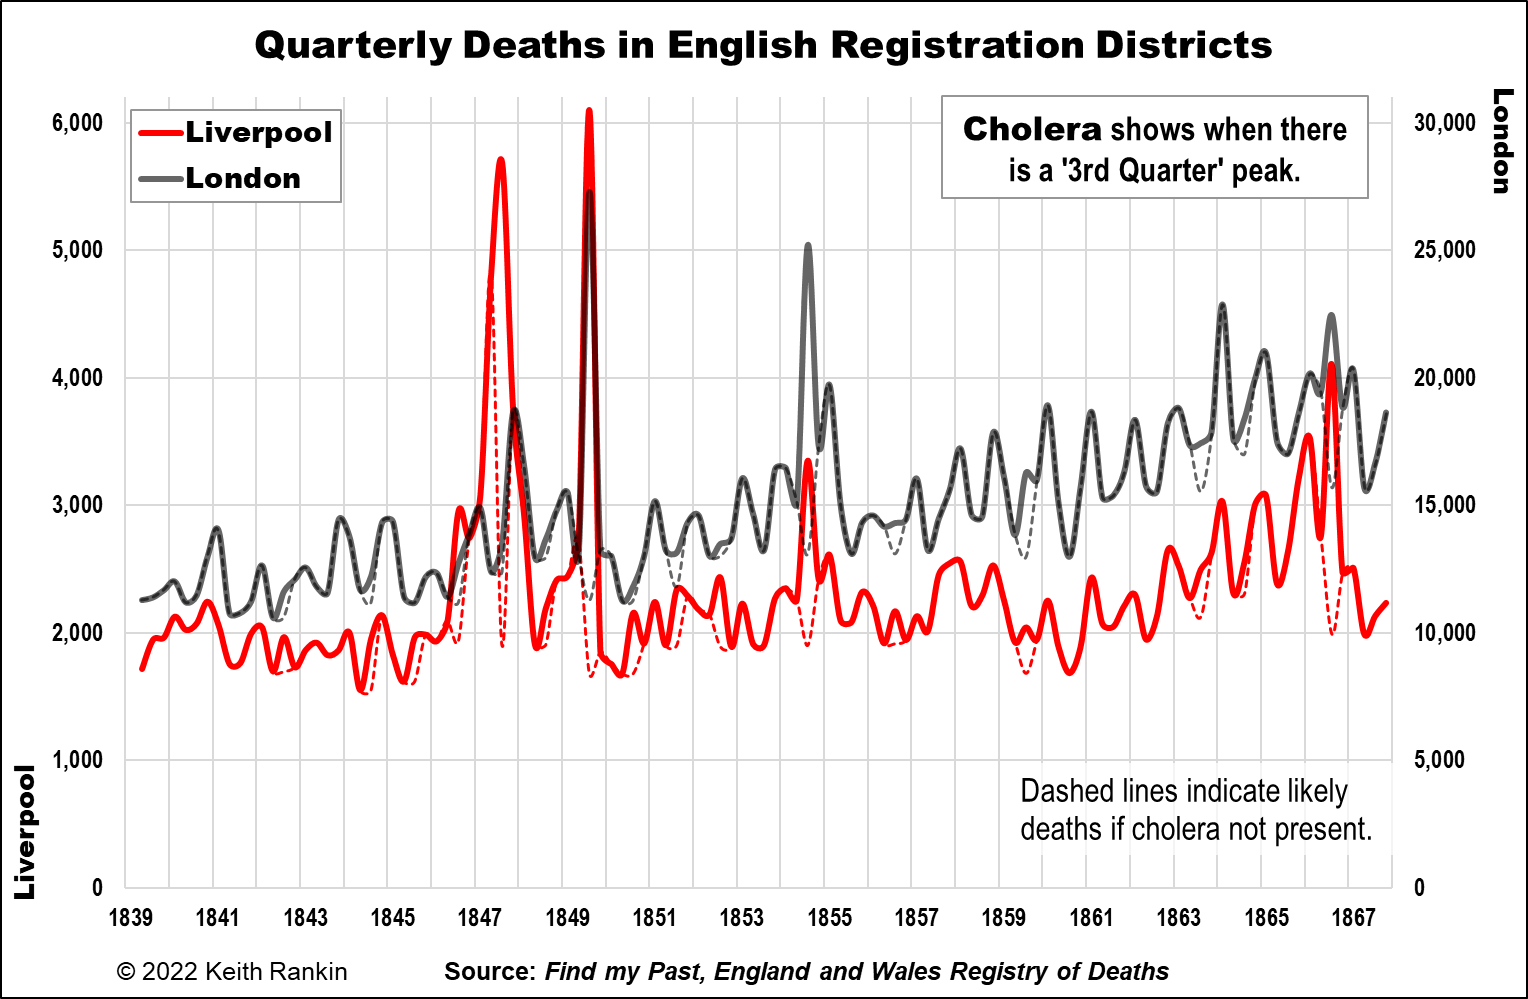
The third chart compares the Strand district of London, which includes Soho, with the rest of London. It shows clearly that the Soho outbreak was comparatively small. I estimate that 50,000 people died of cholera in London during the period, with 12,000 deaths in the 1854 event. Of those 12,000, I calculate 125 deaths in the Strand District, with perhaps 100 of them being due to the contamination of the water in the famous Broad Street pump. A significant local outbreak, but a small part of London’s total experience.
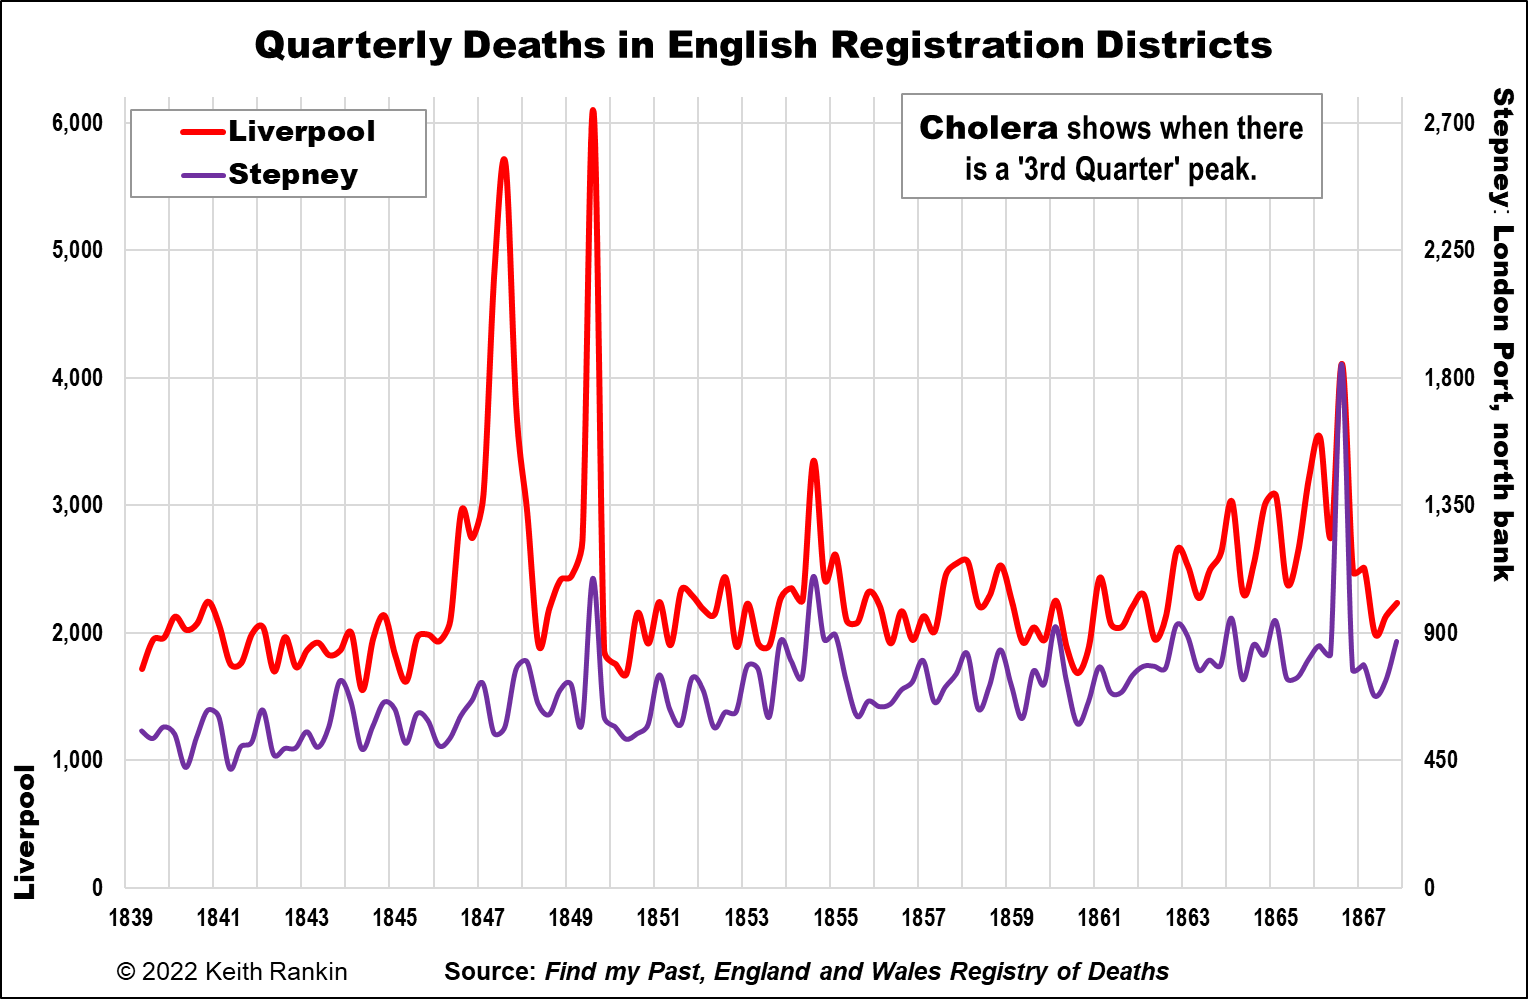
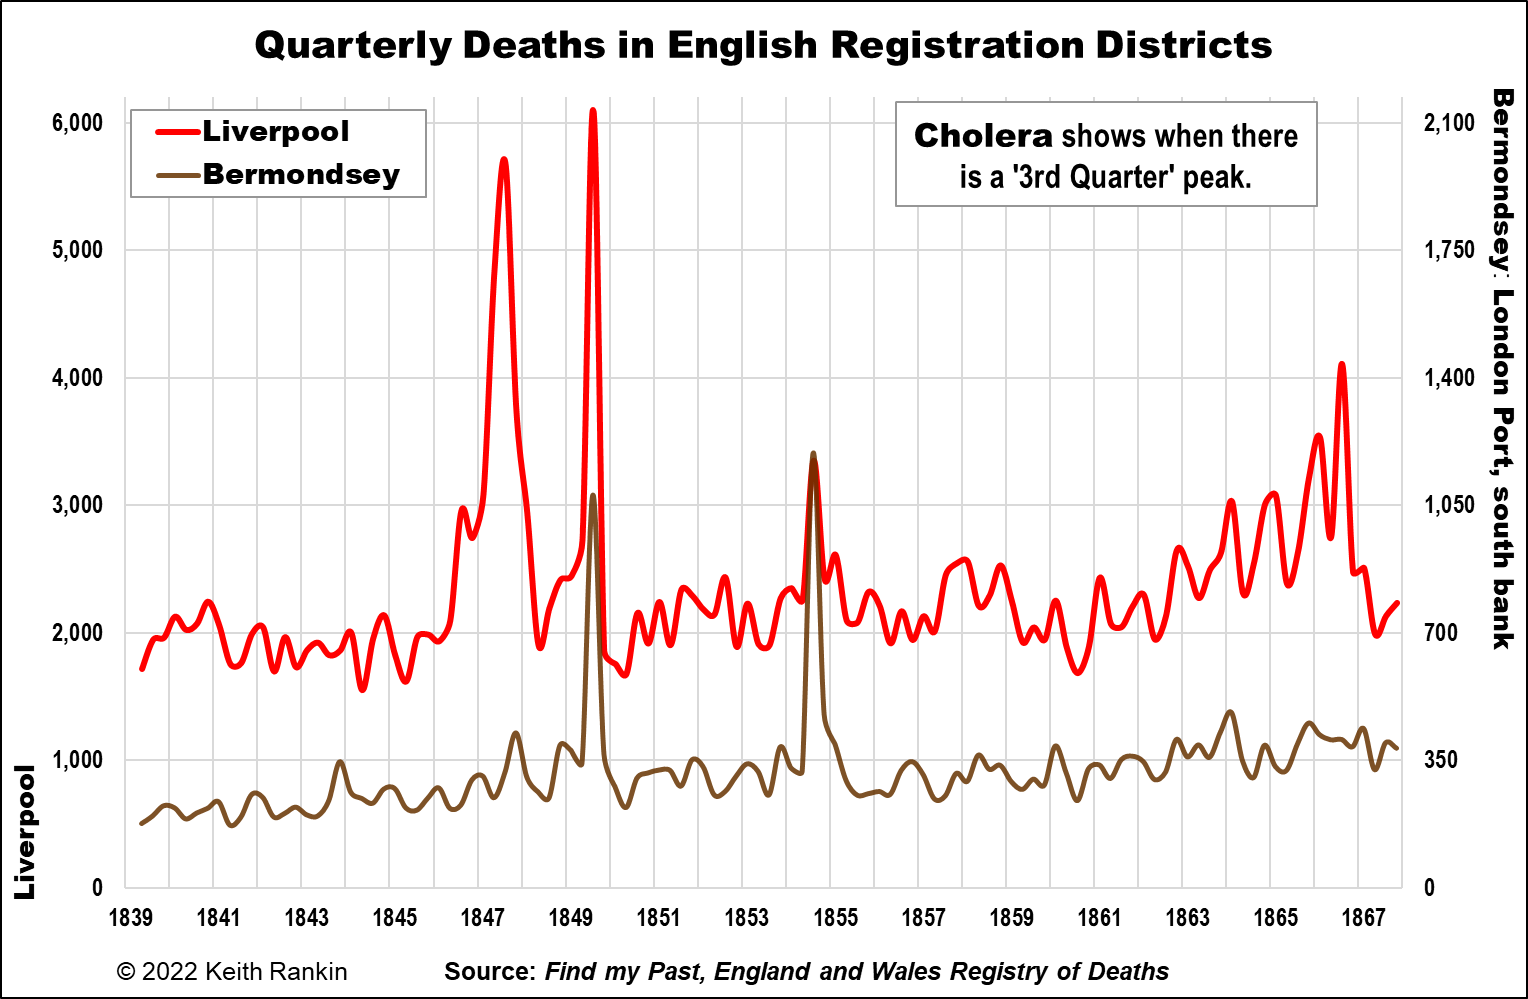
The final two charts refer back to Liverpool. They compare Liverpool with two of London’s major port districts: Stepney and Bermondsey. Stepney District is north of the Thames, downstream from the Tower Bridge. (The Tower Bridge did not exist at the time, however.) Bermondsey is on the south bank of the Thames, again downstream of the Tower Bridge.
Stepney shows three of the four late-summer cholera ‘spikes’: 1849, 1854, and 1866. Indeed the 1866 outbreak was largely confined to Stepney. (Johnson explains why.)Bermondsey, which missed the 1866 outbreak, was more dramatically affected in 1849 and 1854 than most of the rest of London. In 1849 its deaths trebled in the third quarter of 1849, just as Liverpool’s deaths had.
Other major ports of international trade – Hull, Sunderland, Newcastle, Aberdeen, Bristol – also synchronise to one or more of the Liverpool cholera outbreaks. Hull, renown as part of the migrant route from the Baltic to New York had a particularly severe outbreak in 1849. Grimsby, a prosperous fishing port on the other side of the Humber estuary from Hull, had almost none of that, but (unlike Hull) did get a share of London’s 1854 outbreak.
Note on John Snow, and on the multiple arrivals of cholera in Britain
John Snow, by the way, made a very significant professional contribution to medical science for his development of techniques in obstetric anaesthesia. He even attended at least one of Queen Victoria’s births. But he was an ‘establishment outsider’. As an epidemiologist, he was an amateur, as many pioneers were; epidemiology was his ‘hobby’. Nevertheless, in 1849 he effectively proved and published his theory about cholera as being waterborne rather than airborne after fieldwork he did in Bermondsey. However, despite Snow’s conclusive efforts in 1849 and 1854, in Europe as late as the 1890s an ‘expert narrative’ continued to maintain that cholera was an airborne disease. Much of Naples was rebuilt in the 1890s on this basis, though that intervention did not stop cholera returning.
It also turns out that hamburgers were not Britain’s only legacy from Hamburg. All of Britain’s cholera outbreaks appear to have originated in the free port of Hamburg, perhaps Europe’s busiest port city then, and still one of the biggest today. I am waiting to receive the book Death in Hamburg by Richard Evans, from Book Depository.
This is the blurb about that book on Penguin’s website:
‘Why were nearly 10,000 people killed in six weeks in Hamburg [in 1892], while most of Europe was left almost unscathed? As Richard J. Evans explains, it was largely because the town was a “free city” within Germany that was governed by the “English” ideals of laissez-faire. The absence of an effective public-health policy combined with ill-founded medical theories and the miserable living conditions of the poor to create a scene ripe for tragedy. The story of the “cholera years” is, in Richard Evans’s hands, tragically revealing of the age’s social inequalities and governmental pitilessness and incompetence; it also offers disquieting parallels with the world’s public-health landscape today.’
Steven Johnson notes that Hamburg repeatedly launched cholera epidemics upon the world. At the same time as Hamburg’s later episodes, Berlin was the world’s leading centre for research into epidemic diseases, and Germany was a sophisticated society with a rapidly centralising state. Nevertheless, science in its heyday – pure and applied science – failed Hamburg and the world with which it traded.
*******
Keith Rankin (keith at rankin dot nz), trained as an economic historian, is a retired lecturer in Economics and Statistics. He lives in Auckland, New Zealand.