CoveragePost
July 22, 2024
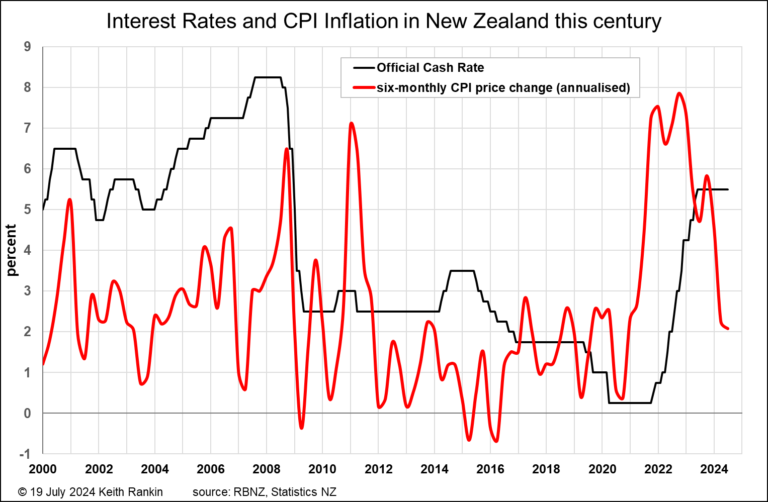
Analysis by Keith Rankin. Interest Rates and Increasing Prices: The Facts The first chart above challenges the received view that inflation in New Zealand remains stubbornly high, and that it is therefore appropriate for the Reserve Bank’s official cash rate (OCR) to be held for at least a few more months at its damagingly high ... <a title="Keith Rankin Chart Analysis – The Truth in New Zealand about Price Inflation and Interest Rates" class="read-more" href="https://eveningreport.nz/2024/07/22/keith-rankin-chart-analysis-the-truth-in-new-zealand-about-price-inflation-and-interest-rates/" aria-label="Read more about Keith Rankin Chart Analysis – The Truth in New Zealand about Price Inflation and Interest Rates">Read more</a>
CoveragePost
July 17, 2024
Analysis by Keith Rankin. In November 1928, New Zealand had its own ‘Biden moment’ when the 72-year-old Sir Joseph Ward appeared to promise that, if his party won that year’s election, the New Zealand Government would borrow £70 million in 1 year, as a fiscal super-stimulus that would get New Zealand out of the economic ... <a title="Keith Rankin Essay – New Zealand’s Joe (Biden/Ward) moment" class="read-more" href="https://eveningreport.nz/2024/07/17/keith-rankin-essay-new-zealands-joe-biden-ward-moment/" aria-label="Read more about Keith Rankin Essay – New Zealand’s Joe (Biden/Ward) moment">Read more</a>
CoveragePost
July 13, 2024
Analysis by Keith Rankin, 12 July 2024. The recent French elections delivered an entirely predictable result; although few in the mainstream media actually predicted it. Instead, the pre-election narrative was that the dastardly ‘far right’ was heading for a win, and that a win for Rally France would presage some kind of disaster for democracy ... <a title="Keith Rankin Analysis – France’s Two-ballot Voting System, and its New Zealand Antecedent" class="read-more" href="https://eveningreport.nz/2024/07/13/keith-rankin-analysis-frances-two-ballot-voting-system-and-its-new-zealand-antecedent/" aria-label="Read more about Keith Rankin Analysis – France’s Two-ballot Voting System, and its New Zealand Antecedent">Read more</a>
CoveragePost
March 29, 2024
Analysis by Keith Rankin. My earlier article – Can ‘Good’ be the Greater Evil? – looked at the issue of how wars should end, and how Good versus Evil framing of international conflicts makes it difficult for participants – especially those who are convinced they are the Good in an epic battle against an Evil ... <a title="Keith Rankin Analysis – World War Two: Baddies and Goodies" class="read-more" href="https://eveningreport.nz/2024/03/29/keith-rankin-analysis-world-war-two-baddies-and-goodies/" aria-label="Read more about Keith Rankin Analysis – World War Two: Baddies and Goodies">Read more</a>
CoveragePost
March 25, 2024
Analysis by Keith Rankin. Much of our conflict in the world has been (at least at the time it was happening) framed as Good versus Evil, and with Good therefore having a moral imperative to prevail ‘at any cost’. Once upon a time – and in my lifetime – many of us regarded War as ... <a title="Keith Rankin Analysis – Can ‘Good’ be the Greater Evil?" class="read-more" href="https://eveningreport.nz/2024/03/25/keith-rankin-analysis-can-good-be-the-greater-evil/" aria-label="Read more about Keith Rankin Analysis – Can ‘Good’ be the Greater Evil?">Read more</a>
CoveragePost
March 25, 2024
Opinion by Keith Rankin. Do we need real income-tax cuts this year? Probably not. Do we need nominal income-tax cuts? Yes, we do. The government should go ahead with its proposed tax cuts, but only to low and middle income earners. The tax cuts should compensate for the inflationary component of the cost of living ... <a title="Keith Rankin Opinion – Tax Cuts?" class="read-more" href="https://eveningreport.nz/2024/03/25/keith-rankin-opinion-tax-cuts/" aria-label="Read more about Keith Rankin Opinion – Tax Cuts?">Read more</a>
CoveragePost
March 21, 2024
Analysis by Keith Rankin. In this article, I will simply present the numbers for the key performance indicators (taken from tradingeconomics.com). And then I’ll give an update on GDP (gross domestic product) data, given today’s data release from Statistics New Zealand, and with the definition of ‘recession’ in mind. An important part of the context ... <a title="Keith Rankin Analysis – Economic Performance: New Zealand versus Japan" class="read-more" href="https://eveningreport.nz/2024/03/21/keith-rankin-analysis-economic-performance-new-zealand-versus-japan/" aria-label="Read more about Keith Rankin Analysis – Economic Performance: New Zealand versus Japan">Read more</a>
CoveragePost
March 20, 2024
Analysis by Keith Rankin. Recessions in the last Ten Years: New Zealand and Japan Tomorrow we will see the latest Gross Domestic Product (GDP) data for New Zealand. It’s worth looking today, however, at what the situation is before that data release (with its revisions as well as new data). And in context by comparing ... <a title="Keith Rankin Analysis – New Zealand in Recession" class="read-more" href="https://eveningreport.nz/2024/03/20/keith-rankin-analysis-new-zealand-in-recession/" aria-label="Read more about Keith Rankin Analysis – New Zealand in Recession">Read more</a>
CoveragePost
March 12, 2024
Analysis by Keith Rankin. On Monday morning on RNZ’s Morning Report, Revenue Minister Simon Watts admitted that it was a legitimate option for ‘landlords’ to leave their houses empty. (Refer Revenue Minister on mortgage tax deductions for landlords, RNZ 11 March 2024.) The official narrative of the elite political class is that when tenancies on ... <a title="Keith Rankin Analysis – Empty Rentals and ‘Investor’-friendly Taxes" class="read-more" href="https://eveningreport.nz/2024/03/12/keith-rankin-analysis-empty-rentals-and-investor-friendly-taxes/" aria-label="Read more about Keith Rankin Analysis – Empty Rentals and ‘Investor’-friendly Taxes">Read more</a>
CoveragePost
March 7, 2024
Analysis by Keith Rankin. In Question Time in Parliament, yesterday, Finance Minister Nicola Willis was asked a question about the extent of the cost of government debt-servicing. The answer, in short, was ‘a lot’; and she mentioned that the cost had been assessed on an interest-only basis. The ensuing round of supplementary questions never got ... <a title="Keith Rankin Analysis – Interest Costs, the Cost-of-Living, and the Cost-of-Government" class="read-more" href="https://eveningreport.nz/2024/03/07/keith-rankin-analysis-interest-costs-the-cost-of-living-and-the-cost-of-government/" aria-label="Read more about Keith Rankin Analysis – Interest Costs, the Cost-of-Living, and the Cost-of-Government">Read more</a>
CoveragePost
February 13, 2024
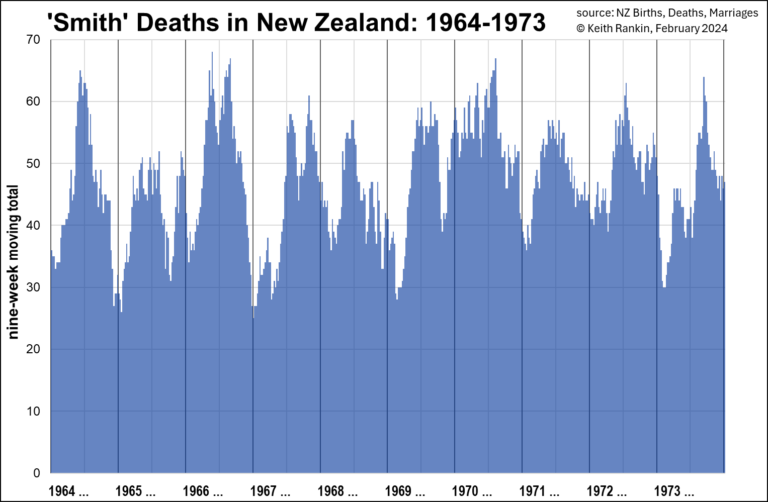
Analysis by Keith Rankin Generally, more people die in winter. Not surprising, though some years have significantly more deaths than others, and the timing of ‘peak death’ each year varies between the wintery months. These charts show the deaths, determined from weekly data, of people named Smith, New Zealand’s most common surname last century. The ... <a title="Keith Rankin Chart Analysis – New Zealand Post-War Mortality: Seasonal Patterns" class="read-more" href="https://eveningreport.nz/2024/02/13/keith-rankin-chart-analysis-new-zealand-post-war-mortality-seasonal-patterns/" aria-label="Read more about Keith Rankin Chart Analysis – New Zealand Post-War Mortality: Seasonal Patterns">Read more</a>
CoveragePost
February 1, 2024
Analysis by Keith Rankin. Collectiveness at it most potent has been called asabiyya by macrohistorian and cliodynamicist Peter Turchin. At its least potent, collectiveness is a recipe for social division, top-heaviness, escalating inequality, and societal breakdown. The present ‘debates’ in Aotearoa New Zealand – ostensibly about Te Tiriti, the Treaty of Waitangi – represent a ... <a title="Keith Rankin Analysis – Collective versus Individual: Māori versus ‘Maoris’" class="read-more" href="https://eveningreport.nz/2024/02/01/keith-rankin-analysis-collective-versus-individual-maori-versus-maoris/" aria-label="Read more about Keith Rankin Analysis – Collective versus Individual: Māori versus ‘Maoris’">Read more</a>