Source: The Conversation (Au and NZ) – By Mark Humphery-Jenner, Associate Professor of Finance, UNSW Sydney

The Albanese government’s efforts to address the gender pay gap are laudable. Despite all the attention given to the issue over the past decade or so, sectoral pay discrimination is very real and workplace biases persist.
But the federal government’s new tool to address the problem, the Workplace Gender Equality Amendment Bill, may not achieve much.
The amendment to the Workplace Gender Equality Act (enacted by the Gillard Labor government in 2012) requires all companies with more than 100 employees to report their “gender pay gap”.
Read more:
How the jobs summit shifted gender equality from the sidelines to the mainstream
Much like the Modern Slavery Act, the idea is that public reporting will concentrate employers’ attention on the problem, leading to greater gender equality.
But will it?
The problem is the type of data companies must report to the Workplace Gender Equality Agency, which has been publishing pay-gap statistics since being established by the Workplace Gender Equality Act in 2012.
As with the other statistics the agency has published over the past decade, the new amendment requires only publishing simple aggregates:
The Agency must publish aggregate information, for each relevant employer for each reporting period, for the purpose of showing the employer’s performance and progress in achieving gender equality in relation to remuneration for the employer’s workforce”
This may seem like a positive step. But aggregate numbers – which in practice translates into reporting summary statistics – do not help us to either identify or understand the pay gap. Those aggregates also don’t help us come up with the right fixes.
To do that requires better data that enables more precise analysis for the factors affecting pay disparities.
The problem with averages
Averages are ubiquitous in statistics. They can serve a important service, such as identifying trends. I’ll even be using averages to illustrate a few points.
But their limitations should be understood. They are particularly problematic when it comes to areas of endemic inequality, such as income.
Consider a company with 101 employees, one being the founder and chief executive. The other 100 employees, split 50/50 between men and women, are all paid the same salary.
But suppose the chief executive pays himself ten times as much as the other employees. This isn’t ridiculous; the average CEO of a listed company in Australia is paid 132 times the average income. This creates a 17.6% gender pay gap.
Now consider a similar company, run by a “tech bro” who doesn’t draw a salary but does pay every single women 2% less than every man. The aggregate numbers will show no gender pay gap.
In the first case, where there’s no explicit gender discrimination, aggregate numbers can be misread as indicating there is. In the second case, actual gender discrimination is obscured.
The WGEA’s pay gap results
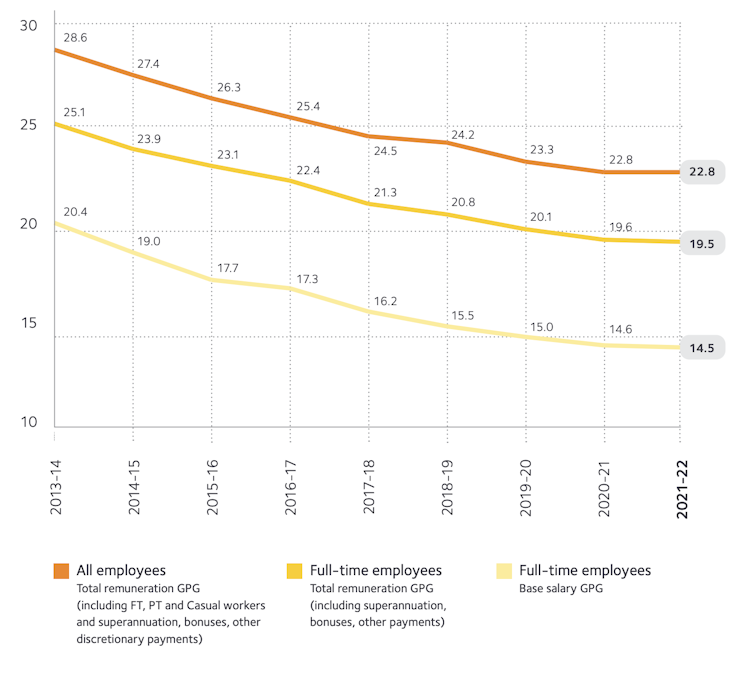
Workplace Gender Equality Agency, CC BY
Poor data leads to poor analysis
The widespread use of averages often skew our sense of things. If you compare your own income to the Australian average (A$90,324 a year in 2021), the probability is you’ll feel left behind. But if you compare yourself to the median income – the income at which half the population earns more, and half less – you’ll feel much better: it’s only $62,868 a year.
Bad data leads to bad analysis, and bad policy responses.
Here’s another scenario. Consider our first company again. The CEO is concerned about the publicity from reporting a 17% gender pay gap to the agency. So he employs his wife as deputy CEO, paying her five times the rest of the staff, and cuts his own salary by half. He no longer has a gender pay gap to report.
This is progress of a kind, but not the progress needed to address the complex causes of gender pay inequality for ordinary people.
Read more:
Women are as likely as men to accept a gender pay gap if they benefit from it
How to fix this problem
So how then to improve the reporting of gender pay statistics generally?
Reporting median statistics would help mitigate the skewing problem with averages. Unless the government demands this, the agency will more than likely keeping taking the same approach as over the past decade – relying on averages.
There’s also a case for companies to report other relevant factors that could influence pay, such as qualifications, skill, tenure, seniority and productivity.
This would enable the Workplace Gender Equality Agency to provide more sophisticated analysis, breaking down the factors contributing to the figures that get the headlines.
The agency defines equal pay as “men and women performing the same work are paid the same amount”. To achieve this, it is essential to ensure apples are being compared with apples. This is only possible if we control for the factors that can influence pay, and don’t lose the necessary nuance.
Blunt data does not properly inform us about the pay gap, why it arises, nor how to solve it. This risks policy responses that focus on the wrong issues and which achieve little.
Decision-makers, both in public and private sectors, risk making bad decisions on poor-quality data. The wrong fixes could even make things worse. We will not eradicate the gender pay gap using bad statistics.
![]()
Mark Humphery-Jenner does not work for, consult, own shares in or receive funding from any company or organization that would benefit from this article, and has disclosed no relevant affiliations beyond their academic appointment.
– ref. Australia’s new pay equality law risks failing women – unless we make this simple fix – https://theconversation.com/australias-new-pay-equality-law-risks-failing-women-unless-we-make-this-simple-fix-199587