Source: The Conversation (Au and NZ) – By Jumana Abu-Khalaf, Research Fellow in Computing and Security, Edith Cowan University
Mining magnate Clive Palmer created controversy last week when he claimed on ABC Radio that 500,000 people had attended the COVID “freedom” protest in Melbourne on Saturday November 20. Maverick MP Craig Kelly opted for the marginally more modest “tens of thousands of people as far as the eye could see”. The official police estimate was 20,000.
Crowd sizes have often been bones of contention. Donald Trump’s US presidency was bookended by competing claims over the size of his inauguration crowd in January 2017, and the number of rioters who stormed Capitol Hill after his electoral defeat four years later.
Read more:
It is difficult, if not impossible, to estimate the size of the crowd that stormed Capitol Hill
But why are crowd sizes so apparently open to interpretation? And what’s the most accurate way to estimate them?
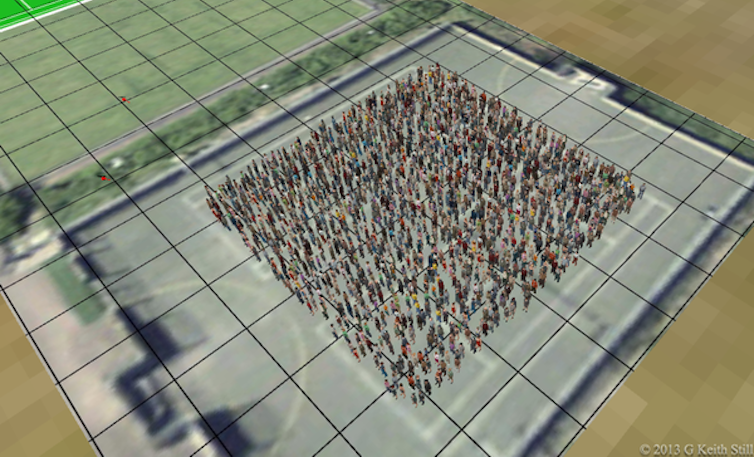
Modern crowd-size estimation techniques are typically based on the Jacobs Method, invented by Herbert Jacobs in the 1960s. Jacobs, who was a journalism professor at the University of California, Berkeley, was watching Vietnam War protesters outside his office window, and noticed they were standing on a paved pattern of repeating squares. He counted the students in a few squares, and calculated the average number of students per square, or crowd density. Then he simply multiplied the number of squares by the density to estimate the size of the crowd.
From his observations, he found that in a light crowd each person takes up about 10 square feet (0.93 square metres), whereas in a denser crowd each person occupies less than half this space. In the most densely packed crowds, each person occupies just 2.5 square feet (0.23 square metres) – referred to by researchers as “mosh-pit density”.
This is considered an upper limit to crowd density, because it is not physically possible for a person to occupy less space. Hence, any crowd estimate that assumes a density higher than that of a mosh pit can be safely discarded.
This basic principle is used by some online tools to estimate and factcheck the number of people standing in a given area. Instead of counting squares, the total area is multiplied by the density to calculate the crowd size estimate. For example, the crowd size in the highlighted section of the Melbourne map below is estimated to be 26,050, based on a density of two people per square metre (we’ll come to how to estimate crowd density in a moment).
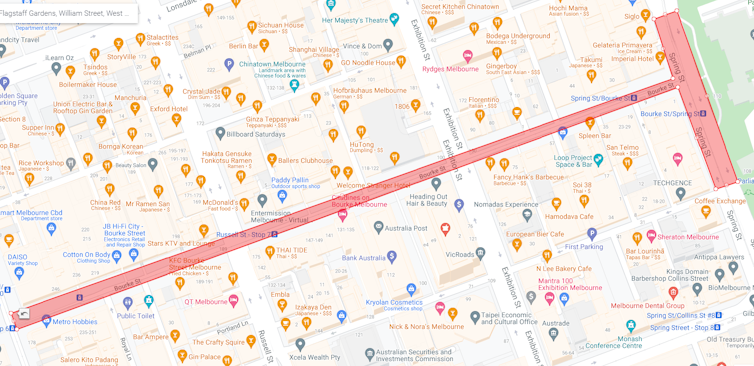
Although these tools give a decent rough estimate of the total crowd size, they assume a uniform distribution of a crowd across an area, which is not realistic. This method also fails to take into account the space taken up by street furniture, cars, trees, or other spaces not occupied by people.
People can bunch together or spread out for different reasons, including seeking shade on hot days or avoiding windy areas in colder months. This can be dealt with by assigning various probable densities to different sections on a map with the help of aerial photos. Some consulting firms claim this method allows them to estimate crowds numbering in the tens of thousands to within 10%.
Estimating crowd density
Estimating crowd density is crucial to producing a good overall estimate, but this technique is naturally prone to human error. In urban areas, CCTV footage can be used, or digital counting systems such as thermal cameras, although these are expensive if covering a large area. Crowd size can also be indirectly inferred from public transport usage, phone location data, mobile data networks, and social media activity, although this may depend on being able to access companies’ proprietary data.
Aerial photography is perhaps the best way to estimate crowd density and size. While ground-based images provide limited views, aerial images offer a literal overview. Images can be collected via satellites, helicopters, balloons or drones (although drones can only be operated by authorised entities in such public spaces). A military satellite image was used to estimate that 800,000 people were present at Barack Obama’s presidential inauguration in 2009.
Having collected aerial images or video stills, there are various ways to estimate how many people are within the frame, depending on the image quality and resolution.
AI algorithms can count people by recognising and counting the distinctive shape of humans, or even just their heads in denser crowds. Statistical methods can also be used to detect the independent motion of the people in the crowd. Or, if the crowd is too packed to count individuals, groups of people can be tracked.
Marchers on the move
It’s harder to estimate the size of a mobile crowd than a static one. The crowd density of a political march can vary significantly as people join and leave at various points along the route, and banners or placards can make people effectively invisible to crowd-detection algorithms.
Some researchers suggest using on-ground inspection points where people are counted. The best estimates are likely to involve multiple complementary methods, such as direct counting, aerial and map-based imagery, and public transport data.
Of course, knowing the size of a crowd is about more than just earning bragging rights for politicians. It is a crucial part of crowd management and safety monitoring at large events such as sports fixtures and music concerts.
Aerial monitoring can also spot dangerous crowd congestion or unexpected behaviour, and first responders can be provided with an estimate of the number of people who may need help or treatment in the case of an emergency.
Read more:
Astroworld tragedy: here’s how concert organisers can prevent big crowds turning deadly
![]()
The authors do not work for, consult, own shares in or receive funding from any company or organisation that would benefit from this article, and have disclosed no relevant affiliations beyond their academic appointment.
– ref. 500,000 or 20,000? How to estimate the size of a political rally properly – https://theconversation.com/500-000-or-20-000-how-to-estimate-the-size-of-a-political-rally-properly-172867